Table of Contents
7.9.6 Confidence intervals
To provide more insights to risks and opportunities Streamline can show probable forecast variability boundaries called the confidence interval.
Confidence interval algorithm
To create the confidence interval, Streamline calculates the Mean Squared Error (MSE) as the first step. The formula for the Mean Squared Error is the following:
,
where:
- n - the number of periods (months or weeks) used in the model;
- actual sales values;
- forecasted values.
Then we estimate the upper and lower confidence intervals for the forecasts using this formula:
,
- Ft - forecast value;
- Mean Squared Error;
- value that depends on the degree of confidence levels. For example, a 95 % confidence level corresponds to z = 1.96. Other z-value examples are in the table below:
| Probability | z |
| 0.50 | 0.674 |
| 0.68 | 1.000 |
| 0.75 | 1.150 |
| 0.80 | 1.282 |
| 0.85 | 1.440 |
| 0.90 | 1.645 |
| 0.95 | 1.960 |
| 0.98 | 2.326 |
| 0.99 | 2.576 |
How to enable confidence intervals in Streamline
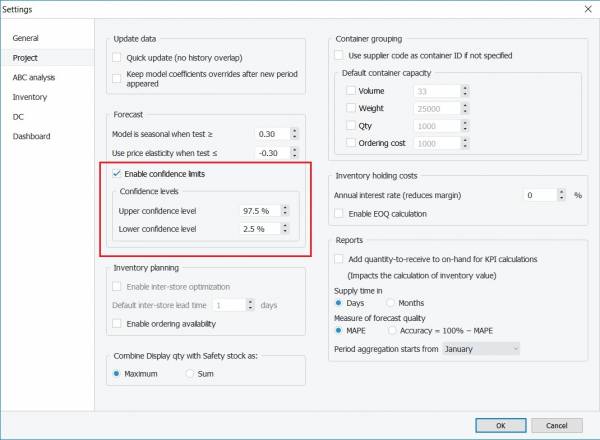
To enable confidence intervals in Streamline, open Settings and go to the Project tab. Then check the Enable confidence limits option in the Forecast section and specify upper and lower confidence levels. Click OK.
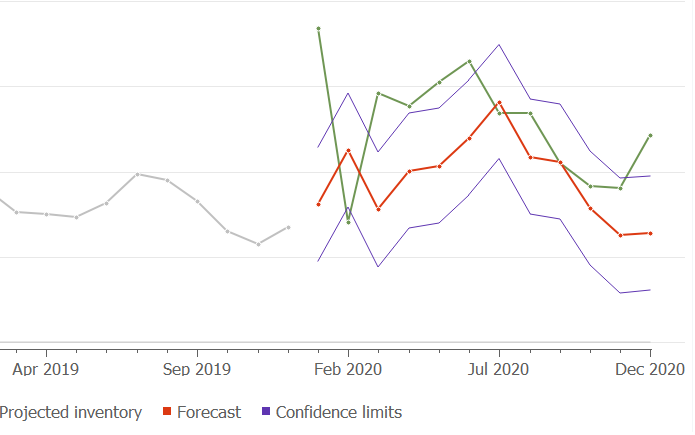
After you enable confidence intervals, the plot will show upper and lower confidence levels in purple. When a user hovers the mouse over the forecast the tooltip shows values of the upper and lower confidence intervals.

