User Guide
1. Streamline Client
2.Streamline Server
3. Starting Up
4. Connecting data
5. Demand and Sales Forecasting
6. Inventory Planning
7. Reference
1. Streamline Client
2.Streamline Server
3. Starting Up
4. Connecting data
5. Demand and Sales Forecasting
6. Inventory Planning
7. Reference
 Add this page to your book
  Remove this page from your book
 The Report tab allows you to create several reports. These reflect historical, current, and projected data for demand forecasting and inventory planning.
Streamline has powerful tools for creating customized reports. Users can display a specific group of items by applying filters to each report type as well as selecting which columns of the reports to display. Moreover, users can aggregate the filtered result by rows and/or columns and make your overrides for custom reports at an aggregated level.
The Report tab includes (see figure below):
It means that Streamline automatically stores the last generated forecasts for each data aggregation period in the project archive. That enables you to go back to a particular period in the past and see what was the data of the mentioned reports at that time.
The Report tab includes (see figure below):
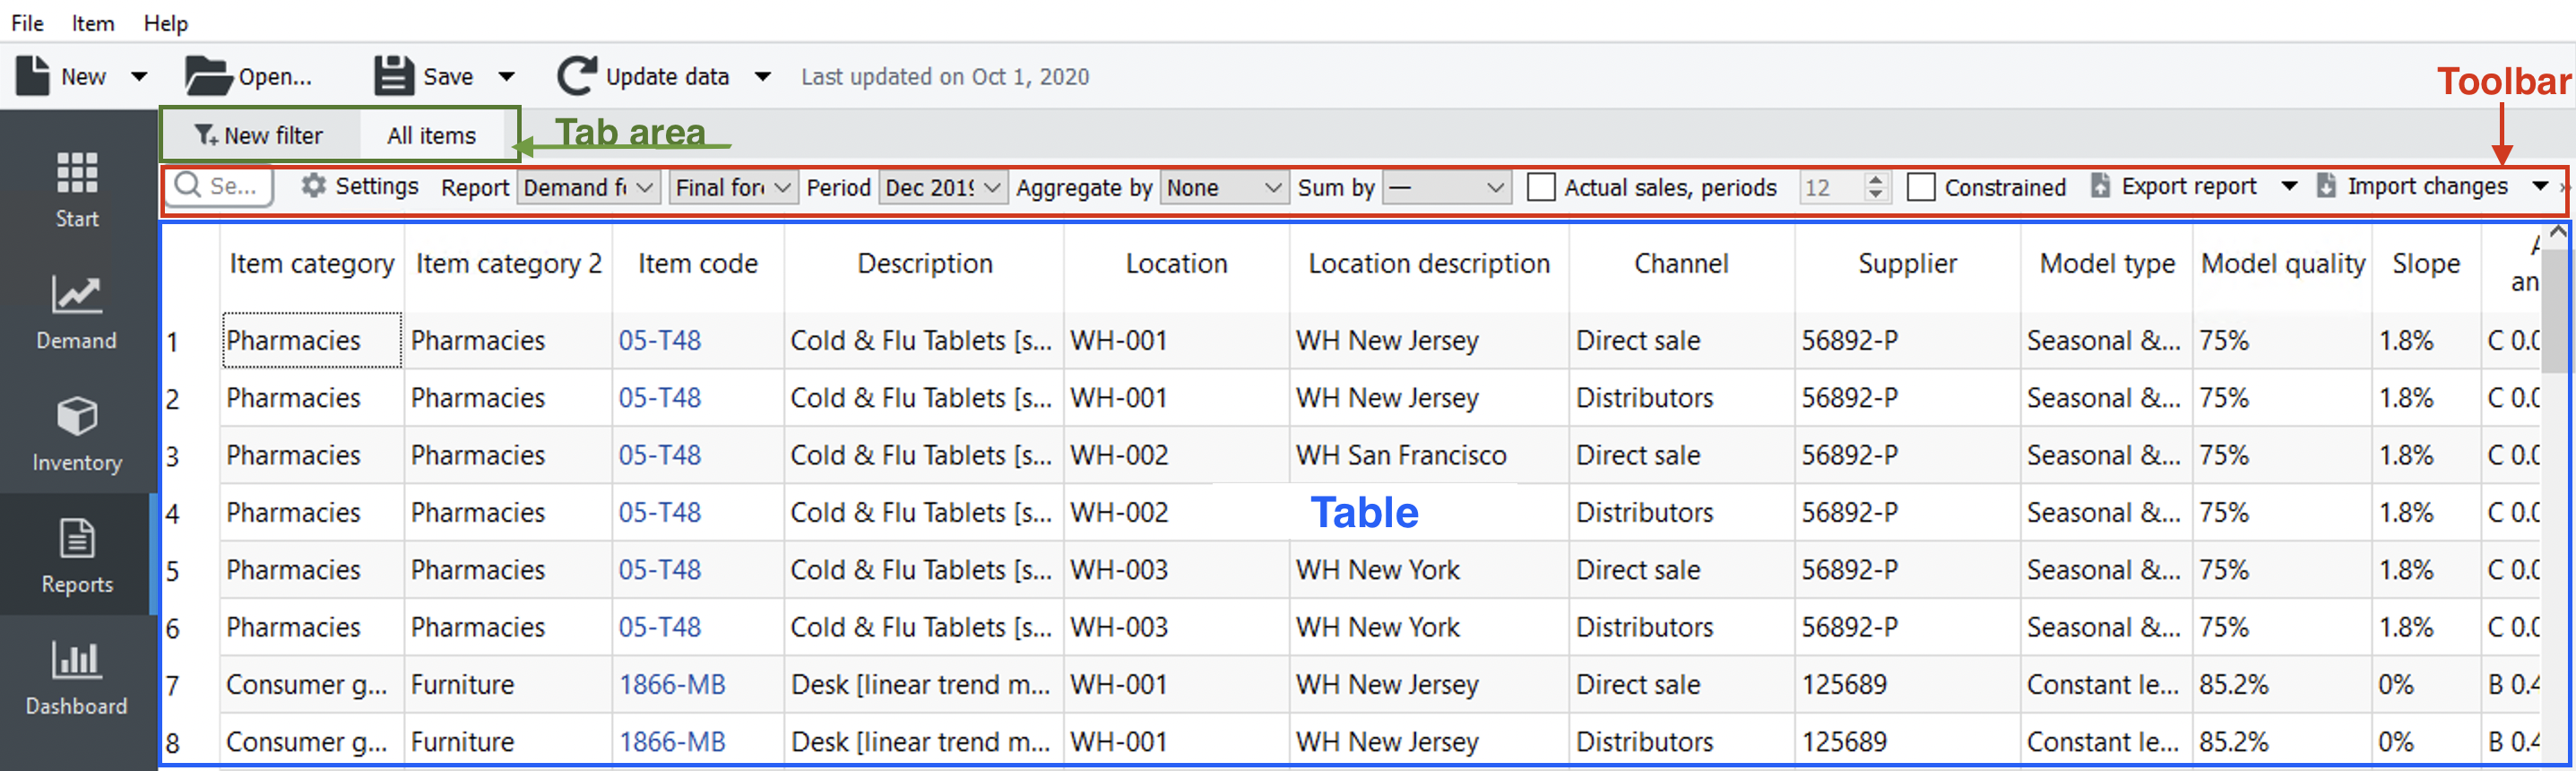
By default, the tab area shows the All items tab and the New filter button. The All items tab is a report showing all planning items (no filters applied) for the report type selected in the Report control of the toolbar.
The New filter button opens the Filter dialog. It is used to create a custom report based on the selected report type and filtering criteria specified in the Filter dialog. As soon as you configure the filter, Streamline creates a new report based on it and adds it to the set of tabs as a newly created tab.
The toolbar holds buttons and controls to customize the currently active report. The exception is the Show columns control; it shows columns for all reports. The toolbar changes depending on the selected report type and displays controls that apply to this type. Below we list toolbar elements, which differ for each report, but the shown one is the most comprehensive and can be found in the Demand forecasting report.

Below, you may find report types and the categories they belong to.
These are:
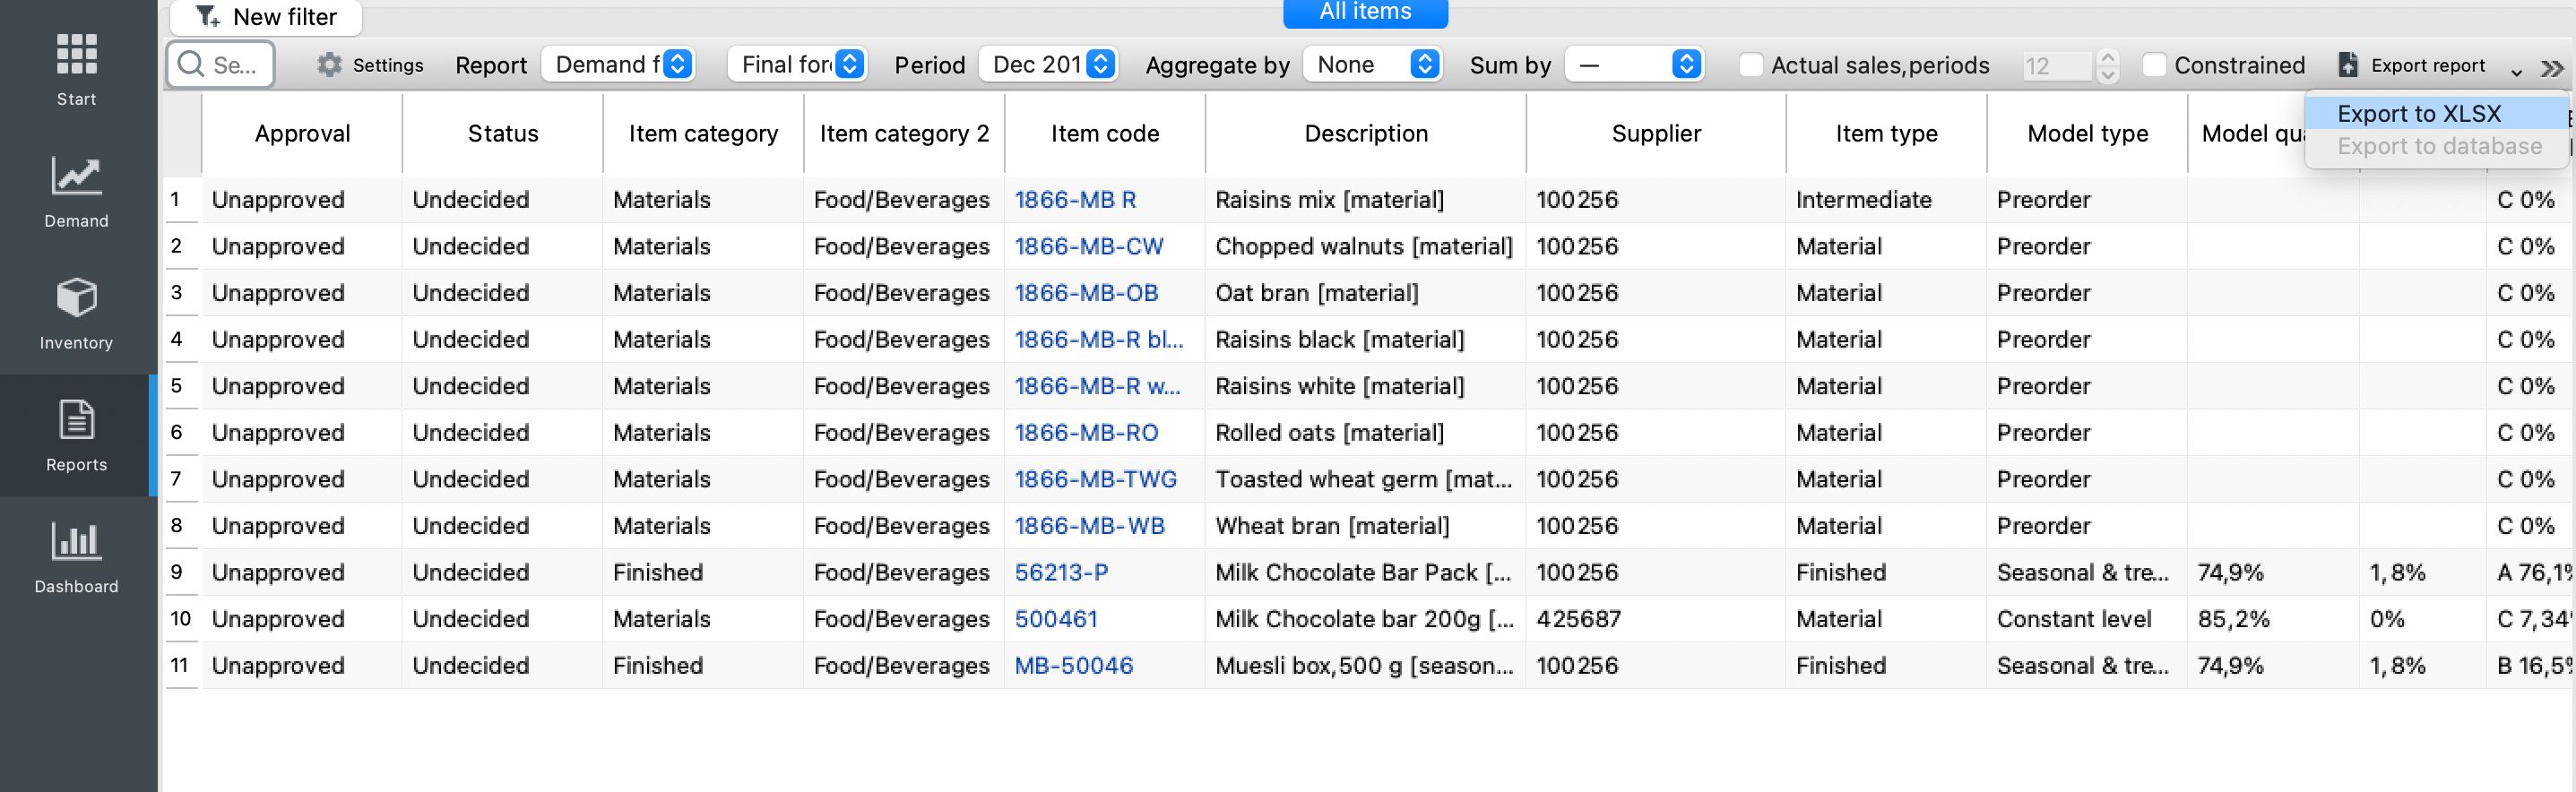
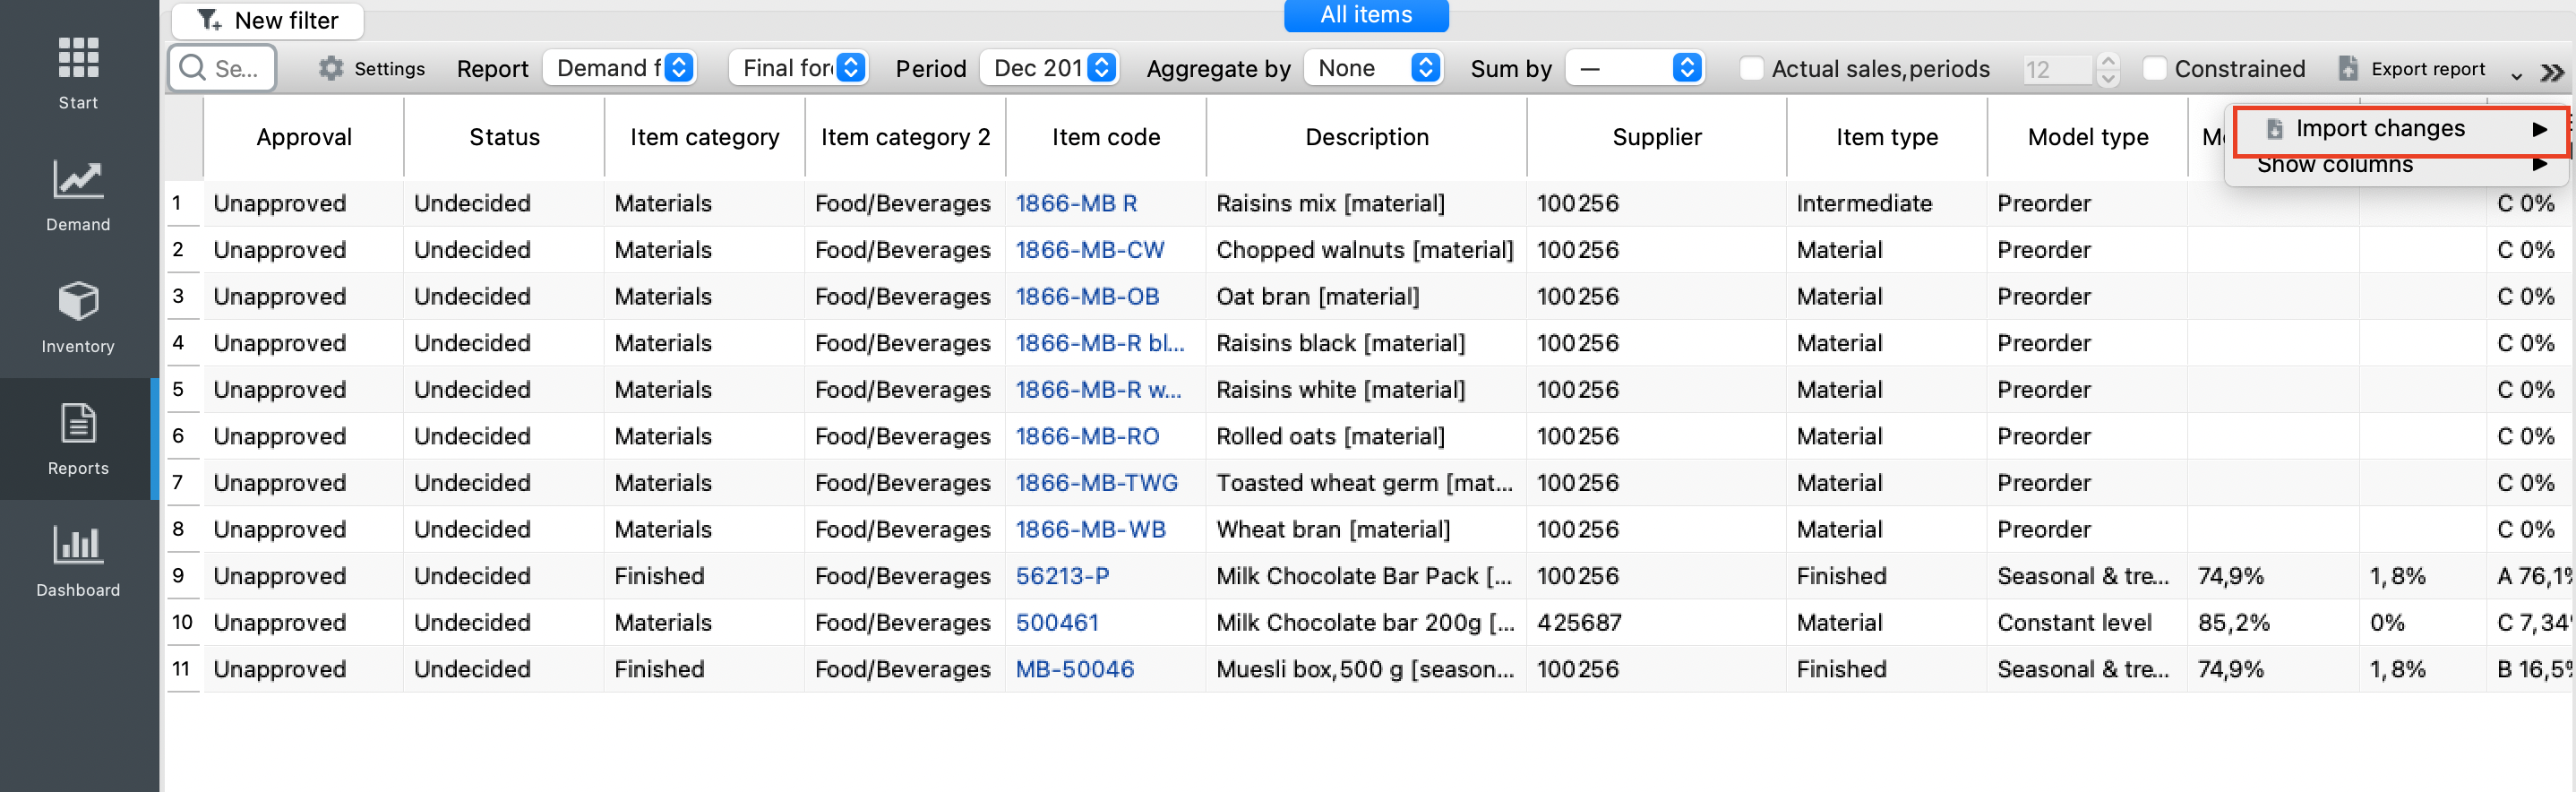
To accomplish the export/import scenario, the user has to take the following steps:
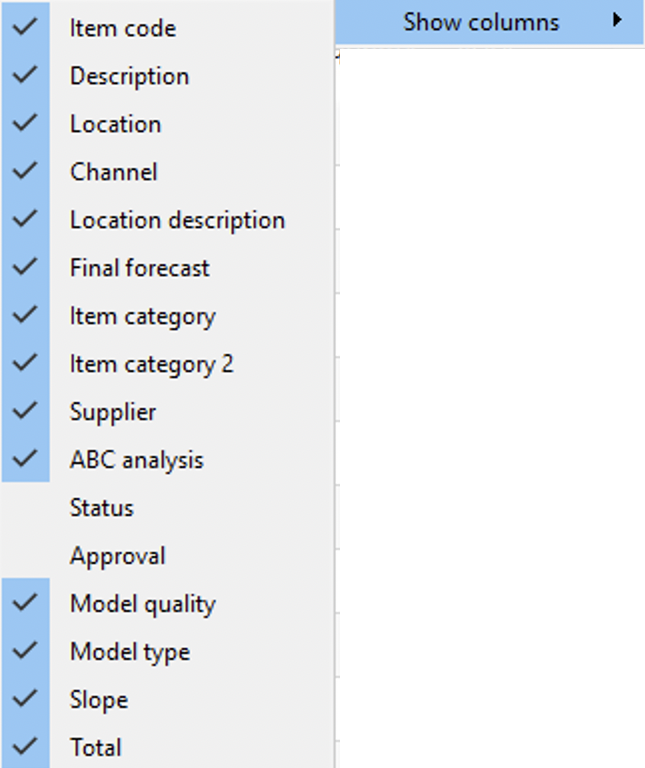
Show columns button opens a check-box menu where each item represents a column of the report header section that can be shown/hidden by toggling it (see figure below). As we said, this shows/hides columns for all of your custom reports in the Reports tab.
Below, we list all of the report types and give a description for each of them.
| Report type | Description |
|---|---|
| Projections reports | |
| Demand forecast | Shows the statistical forecasts, including your manual forecast overrides. |
| Forecast overrides | Indicate only your forecast overrides. It is useful when you need to export those to Excel. |
| Forecast performance | Shows the measurement of forecast accuracy. |
| Confidence limits | Displays upper and lower levels of confidence limits for the SKUs. |
| Planned vs. Actual sales | Shows the measure of forecast performance based on the comparison between planned and actual sales. |
| Ordering plan | This report displays the ordering plan for your inventory in quantity or value |
| Projected revenue | This report indicates expected revenues based on the current/future adjusted selling prices |
| Projected sales price | This report shows future selling prices based on the current prices or their manual overrides. In the case of seasonal price forecasting, it shows the generated forecasts. |
| Projected inventory | This report shows expected inventory levels calculated based on the ordering plan. Those can be represented in quantity or value. |
| Projected write-offs | This report indicates expected write-off amount/value based on the imported batches' expiration dates |
| Projected stockouts | This report shows the expected stockout amounts for each period in the future |
| Expected to receive | Shows the items amounts expected to be received |
| Expected to ship | Shows the items amounts expected to be shipped |
| Historical reports | |
| Historical revenue | Shows the revenue obtained during each period in the past based on the item price or transaction revenue |
| Historical stock on hand | Displays on-hand at the end of each period in the past. It includes the current on-hand as well. |
| Historical stockout days | Show the number of days you had run out of stock for each period. The current period is also included in this report. |
| Historical turnover | Indicates the turnover of every planning item for each period in the past. |
| Current state reports | |
| KPIs | Show essential indicators of the current project performance, including inventory turnover, turn-earn index, gross margin, and others |
Each report contains a table. The table is divided into two sections, a header section and a data section (see figure below).
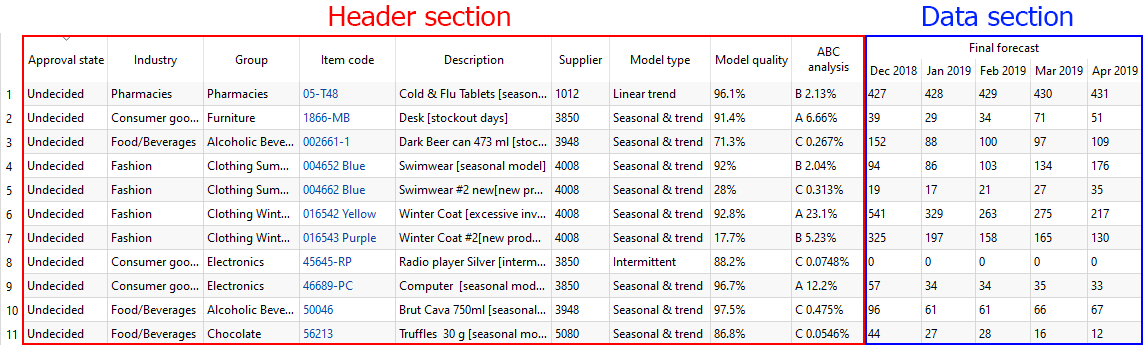
The header section is not changed depending on the report type selected. It provides characteristics and descriptive information about planning items that can be used to filter a particular set of items.
The data section displays the report content.
The table below describes the columns of the header section.
| Column | Description |
|---|---|
| Approval status | Indicates the forecast approval status for each planning item |
| Status | Indicates the status of an item |
| Item code | The code for the item |
| Location | (Optional) The name/code of the warehouse/store where the item code is stocked |
| Channel | (Optional) The channel, the item code is sold through |
| DC | (Optional) The name of the distribution center that supplies the Item code to the Location |
| <Item category> | (Optional) The category, the item code belongs to. It is imported from the data source. The name of the imported item category is shown in the column header. |
| <Location category> | (Optional) The category, the location belongs to. It is imported from the data source. The name of the imported location category is shown in the column header. |
| <Info field> | (Optional) A custom item characteristic imported through the item info field from the data source. The name of the characteristic is displayed in the header of the column. |
| Description | (Optional) The description for the item code |
| Location description | (Optional) The description for the location |
| Supplier | (Optional) The supplier for the planning item |
| Model type | Indicates the model type used to generate forecasts for the planning item |
| Model quality | Shows the model accuracy calculated using the formula:
where:
If a period doesn't have sales (Ai = 0), the term in the sum is substituted by zero. |
| Slope | Shows the slope of the trend represented in percentages. |
| ABC analysis | Shows the result of ABC analysis |
The report table is sortable by any column and even by an ordered set of columns.
 Manage book (
 Help
Help