User Guide
1. Streamline Client
2.Streamline Server
3. Starting Up
4. Connecting data
5. Demand and Sales Forecasting
6. Inventory Planning
7. Reference
1. Streamline Client
2.Streamline Server
3. Starting Up
4. Connecting data
5. Demand and Sales Forecasting
6. Inventory Planning
7. Reference
 Add this page to your book
  Remove this page from your book
 KPI (Key Performance Indicators) report shows important indicators of the current project performance. Streamline calculates a variety of indicators. Most of them evaluate the inventory planning process.
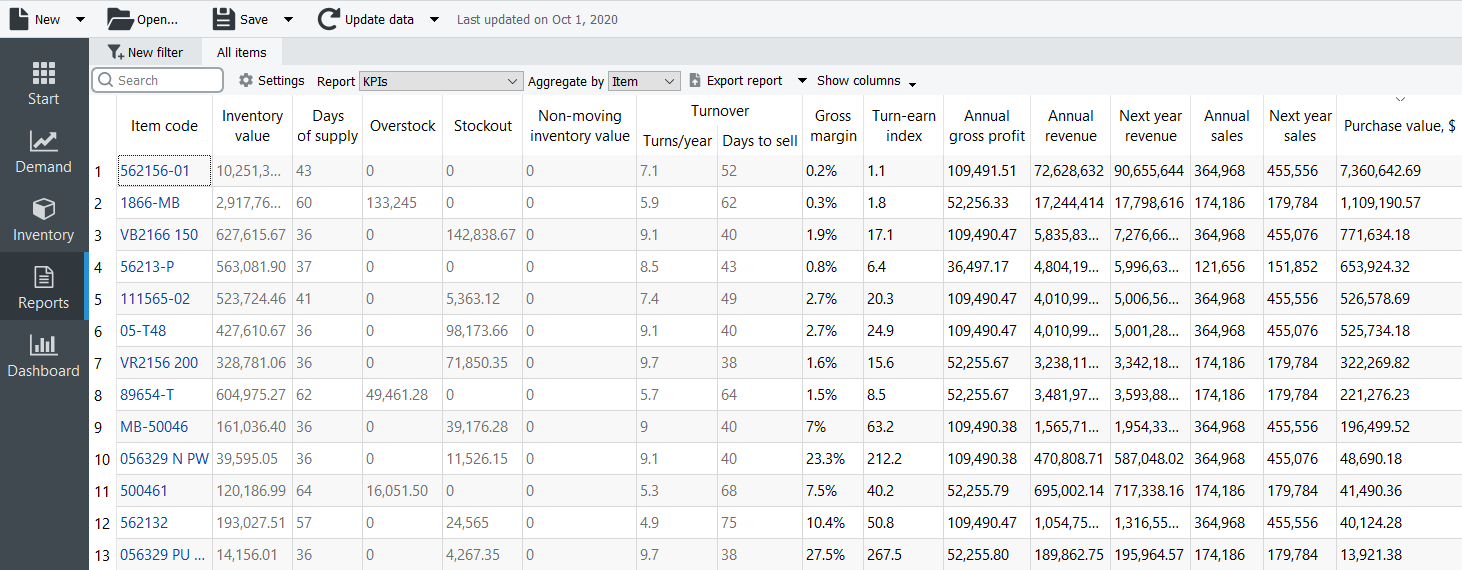
The table below is a brief description of the indicators.
| KPI | Description | |
|---|---|---|
| Inventory value | Indicates the value of the item in stock | |
| Days of supply | Shows how many days of the future demand, starting from the project date, the current On hand (including orders to ship) can cover. You can choose the representation units for this indicator between days or months in the Settings. | |
| Overstock | Indicates the value of the expected item overstock | |
| Stockout | displays the value of the expected item shortage | |
| Non-moving inventory value | Specifies the balance value of the item in stock. It is calculated if the item will not be sold during the forecast horizon period according to the forecast. | |
| Turnover | Turns/year | Shows how many times an item was purchased and then sold out for the last 12 months |
| Days to sell | Indicates how many days it takes to complete one turnover cycle | |
| Gross margin | Displays a gross profit margin for the item | |
| Turn-earn index | Specifies an item gross margin accumulated over the last 12 months | |
| Annual gross profit | Shows an aggregation of the transactions' profit over the last 12 complete months | |
| Annual revenue | Shows the averaged item revenue over the last 12 months | |
| Next year revenue | Indicates the expected item revenue for the next 12 months according to the forecasts | |
| Annual sales | Displays the total amount sold in quantities over the last 12 months | |
| Next year sales | Displays the expected amount to be sold for the next 12 months | |
| Purchase value | Displays the purchase amount for each planning item | |
Below we give a more detailed description of these KPIs.
There is a set of KPIs that depends on the item value. Item value is a characteristic that is taken as Inventory value/unit or Purchase price/unit data type. If both data types are given, the former is taken as the item value.
Item value-dependent indicators are the following:
Below we explain how they are calculated.
The Inventory value indicator shows the value of the item in stock. If it is not imported directly using the Aggregated spreadsheet connection, it is calculated as:
Inventory value = item value * On hand.
The Expected overstock value indicator indicates the expected overstock value for an item. It is calculated as:
Expected overstock value = item value * overstock_qty.
The Non-moving inventory value indicator is calculated for those items that will not be sold during the forecast horizon according to the forecast. Streamline doesn't compute this KPI for items that are forecasted using an intermittent demand model. The formula for this indicator is:
Non-moving inventory value = item value * On hand.
The Gross margin indicator is the monthly gross profit margin. Its calculation is based on the compound interest and the formula looks like:
,
inflationCoefficient = 1 + interest rate,
selloutTime = (lead time + Days to sell) / 365.25,
where:
This indicator is an aggregation of transactions' profit over the last 12 complete months. It is calculated in two ways depending on the available data:
,
where:
t-th period. It can be calculated if the Sales price/unit data type was imported;t-th period.Streamline uses the first method primarily.
The Expected stockout value indicator is the expected inventory deficiency value in the base currency. It is calculated as:
Expected stockout value = avg sales price * stockout_qty,
where avg sales price is the average sales price in the current period. If we don't have sales in the current period, data of the previous period is used.
Inventory turnover tells how many times an item was purchased and then sold out over a particular period of time. Its formula looks like:
,
where:
i-th day;i-th day. It is determined based on On hand change or On hand (as remaining after a transaction) imported from the data source.If sales history can't cover the period, it is brought to it proportionally using the formula:
where:
i-th day.The Turns/year column of this report shows the turnover over the last 12 months.
This indicator shows an item gross margin accumulated over the last 12 months and calculated as:
Turn-earn index = Gross margin * Turns/year.
This indicator is usually used to rank products and find the most profitable items.
Let’s explain how this indicator is calculated. Consider the product sales history depicted in the figure below.
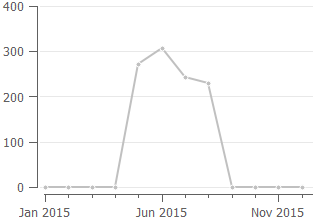
To calculate annual revenue in this case, Streamline always skips zero demand before the sales have started. So only the sales of the last 8 months are taken into account. The formula looks like:
Annual revenue = RevenueMay-Dec / 8 * 12
If we have sales history shown in the figure below, then sales of all the months are taken into account:
Annual revenue = RevenueJan-Dec / 12 * 12
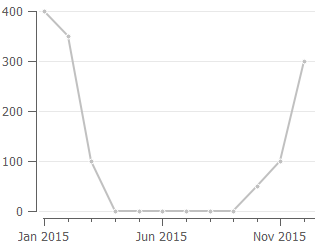
So, as you see, this indicator depends on the sales history of the last 12 months, and thus, may significantly change from month to month.
If the forecast horizon is one year, the next year's revenue is the summed revenue of the next 12 months. Otherwise, it is calculated proportionally using the available data. For example, if data aggregation period is one month, this indicator is calculated as:
Next year revenue = Revenuen /n * 12,
where:
The annual sales value sums up the quantity sold over the past 12 months. It can be found in the Actual sales line in the Demand Tab.
The next year sales value indicates a possible amount to be sold. It’s a sum up of the forecast in quantities for the next 12 months.
This indicator shows the purchase amount for each planning item. It is calculated based on the current purchase recommendations. This column allows you to view the total purchase amount by each supplier if you group this report by the Supplier using the Aggregate by drop-down.
 Manage book (
 Help
Help