User Guide
1. Streamline Client
2.Streamline Server
3. Starting Up
4. Connecting data
5. Demand and Sales Forecasting
6. Inventory Planning
7. Reference
1. Streamline Client
2.Streamline Server
3. Starting Up
4. Connecting data
5. Demand and Sales Forecasting
6. Inventory Planning
7. Reference
 Add this page to your book
  Remove this page from your book
 Streamline can perform one- or two-dimensional ABC analysis based on:
In this article we:
One-dimensional ABC analysis consists in the division of all SKUs (items) into three categories or classes, A, B, and C, based on the given criteria. Class A includes items making up the lion's share of the total criterion value – these are the “best” items in terms of this criterion. Items of classes B and C share the rest of the total.
To perform the analysis, the user should set up three things:
Typically, class A comprises 70% of the total criterion value, class B – 20%, and class C – 10%. For example, the item Computers represents 39% of all Revenue and 44.4% of Profit.
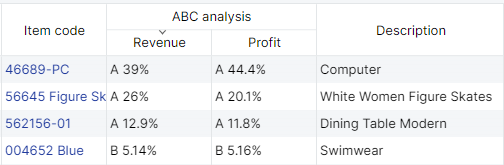
A-items with the highest revenue make up for 70% of the annual revenue in the revenue-based analysis. Streamline allows for adjusting the share for each class as well as the number of classes.
Streamline allows you to activate an additional axis in the ABC analysis and divide the items into classes based on two criteria. For instance, you need to analyze your items from two points of view simultaneously and find those that generate the highest revenue and gross profit, or are the most saleable and profitable at once. Streamline enables you to set up the number of classes and class shares for both axes.
To perform ABC analysis in Streamline, specific types of data should be imported as described below.
The necessary data for each type of ABC analysis is shown in the table below.
| Analysis type | Data |
|---|---|
| Unit-based | Sales history, typically always imported. |
| Revenue-based | Revenue history or current selling price. |
| Gross profit-based | Sales price/unit (or Transaction revenue) and inventory value (or item purchase price). |
| COGS-based | Inventory value or item purchase price. |
| Inventory value-based |
The item purchase price indicated in the table can be only used if its currency coincides with the project base currency.
Unit-based
You do not have to provide any additional data to enable Streamline to perform unit-based ABC analysis. Streamline uses the basic sales history data, for the calculations. Thus, this kind of analysis can be explored by default.
Revenue-based
Different data representing an item revenue history should be provided depending on Streamline’s data connection.
In the Aggregated spreadsheet connection the revenue history can be imported directly using Excel files. If you can’t provide it, the analysis can be carried out based on the sales price/unit as a reasonable substitute.
To import the revenue history using the Transactional spreadsheet connection or Database connection, you should provide the selling price for a single sales transaction or the selling price of one unit in this transaction in your data.
Gross Profit-based
For a Gross profit-based analysis, if you import data through Transactional spreadsheet connection or Database connection, you should provide:
If you use the Aggregated spreadsheet connection, Streamline requires:
Inventory value/unit or inventory value is preferable to item purchase price in this case.
COGS-based and Inventory value-based
Streamline requires you to provide either the inventory value/unit, inventory value, or the item purchase price if you use the Aggregated spreadsheet connection. In this case, the inventory value/unit or inventory value is preferred.
If you import data using Transactional spreadsheet connection or Database connection, you should provide the inventory value/unit (preferred) or the item purchase price.
Streamline performs the revenue-based ABC analysis if there is enough data otherwise, the unit-based type is performed.
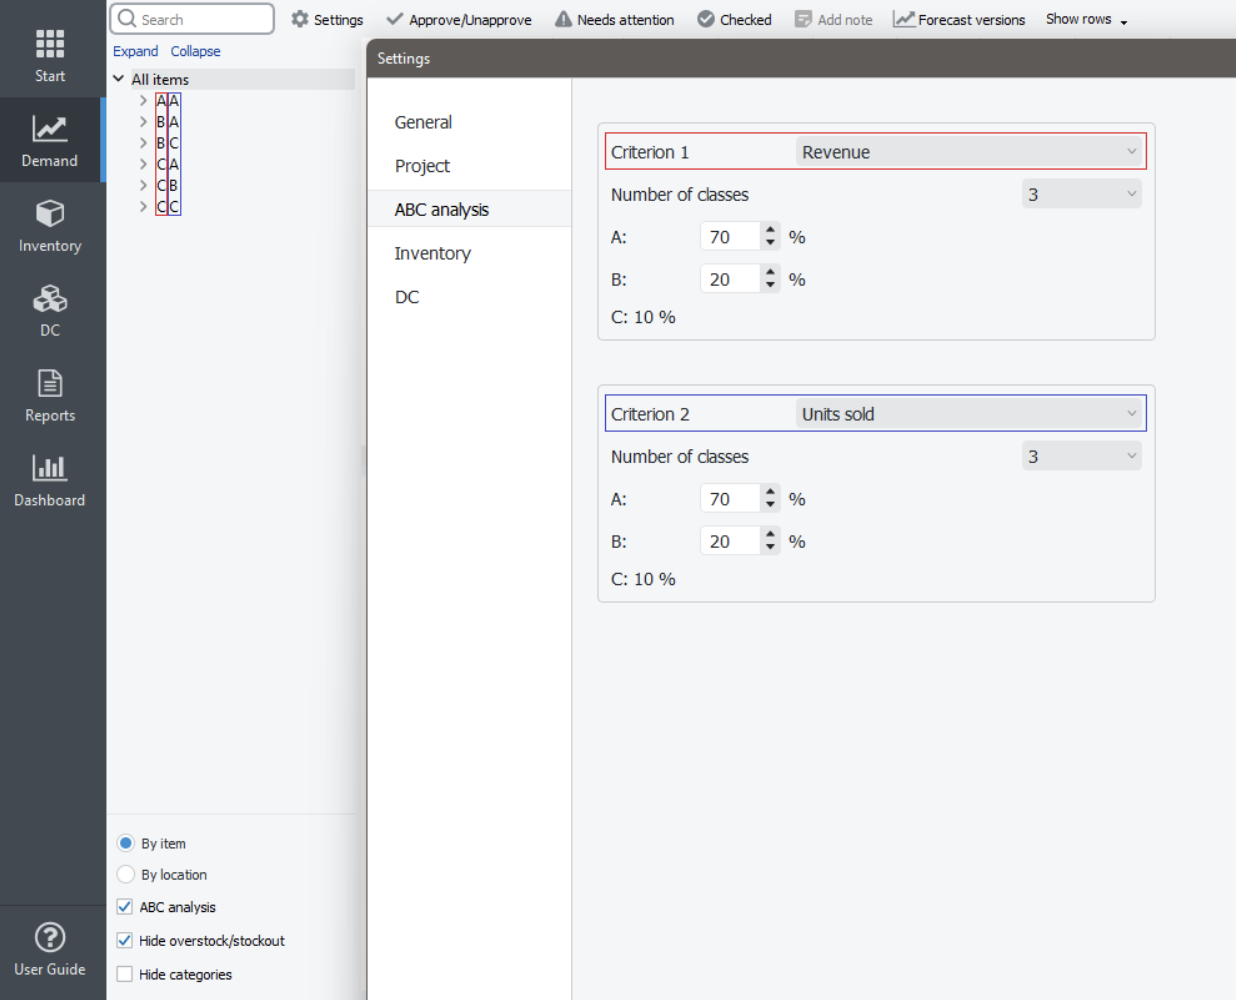
To set up the parameters of the analysis such as the number of dimensions, the criteria for each dimension, and other, go to the menu File > Settings > ABC analysis tab (see figure below).
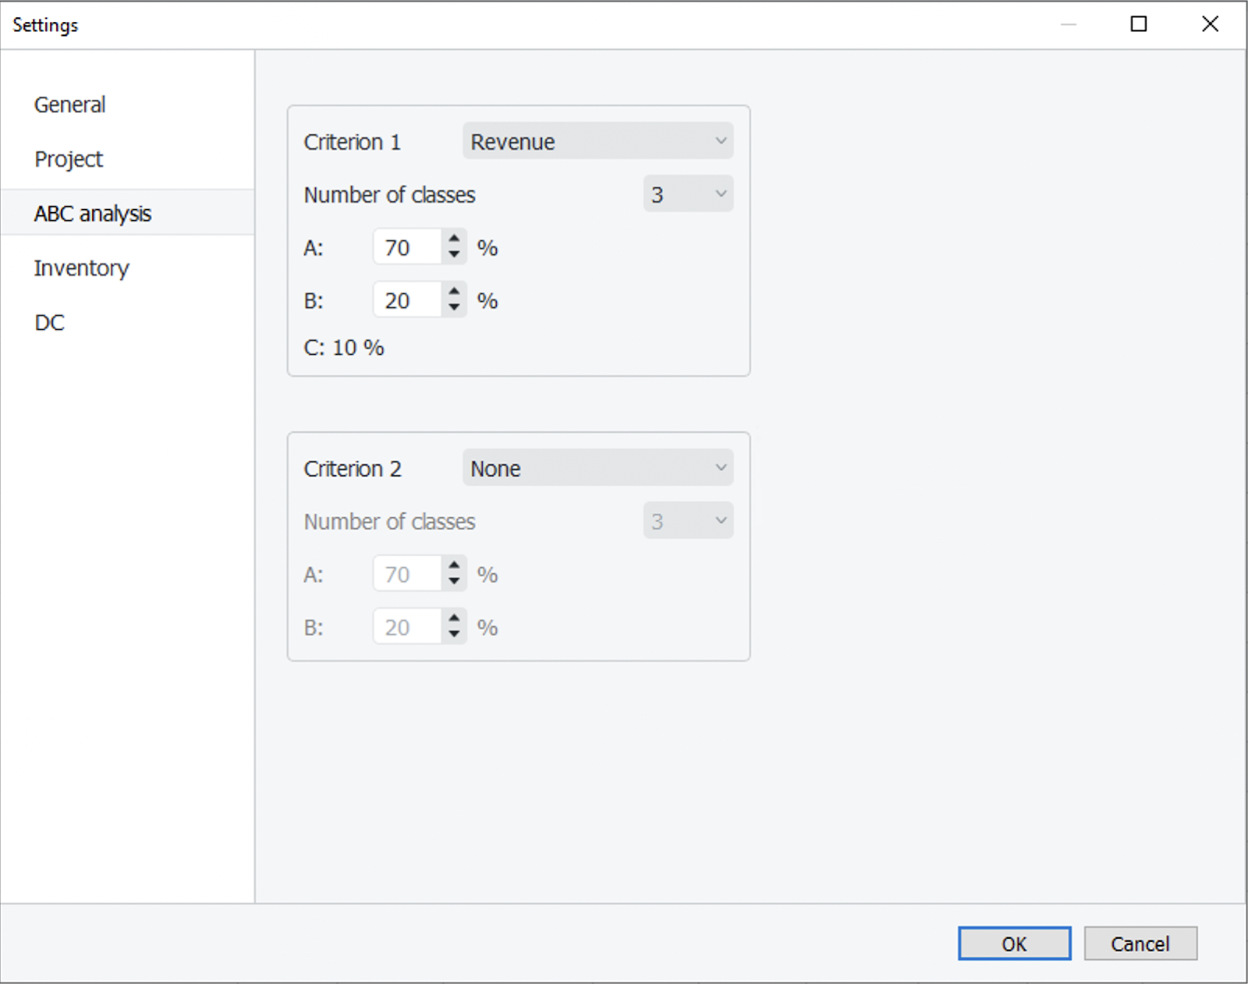
The Criterion 1 control defines the criterion for the first dimension and Criterion 2 for the second one. If Criterion 2 is set to None, the one-dimensional ABC analysis will be performed. Otherwise, Streamline carries out the two-dimensional ABC analysis. The controls below the criteria set the number of classes and the percentages for each class. The percentage for the last class is calculated automatically.
To perform the two-dimensional ABC analysis based on the revenue and sold quantities, configure the ABC settings as shown in the figure above.
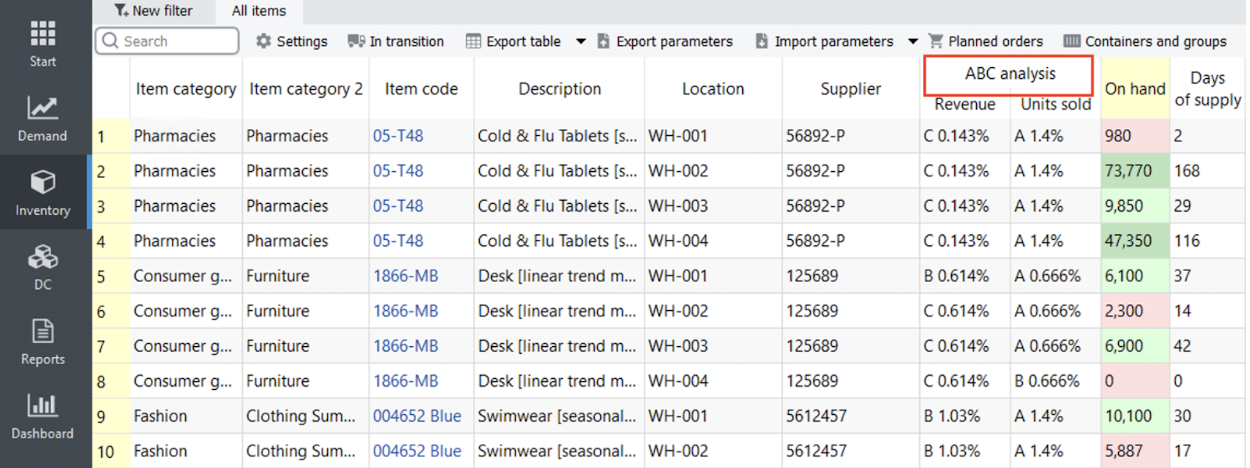
A result of ABC analysis can be viewed on the Reports tab by the ABC analysis column of the table (see figure below).
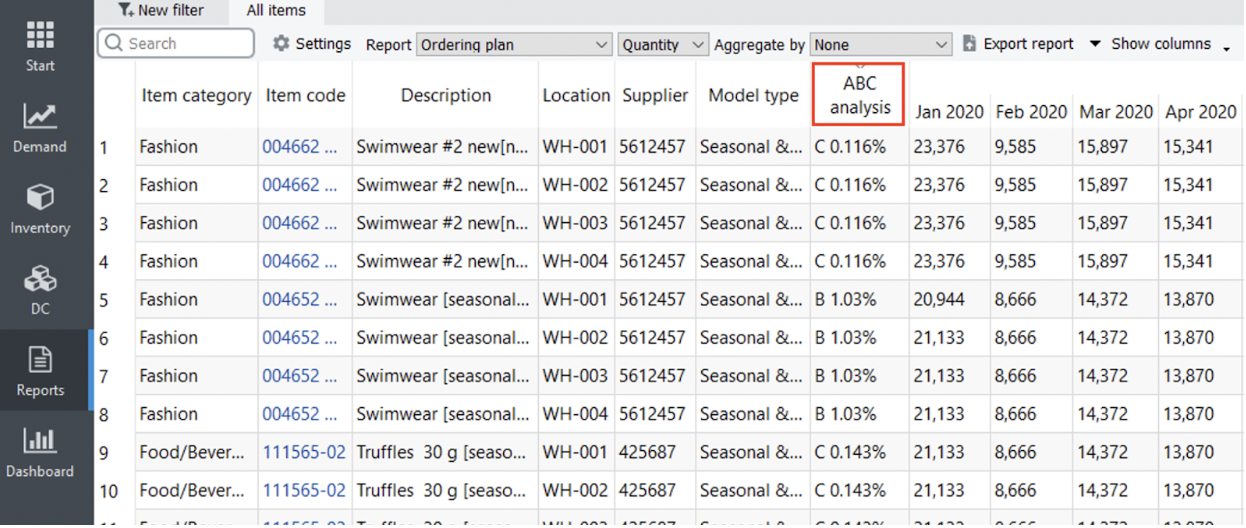
To find which items belong to the particular class quickly, sort the table by clicking on the column header. The ABC analysis column is shown regardless of the report selected in the Select report control.
The report shows information at the lowest level of detail, the planning item level by default. To see it at the SKU level (if locations are used), choose the Item option in the Aggregate by control.
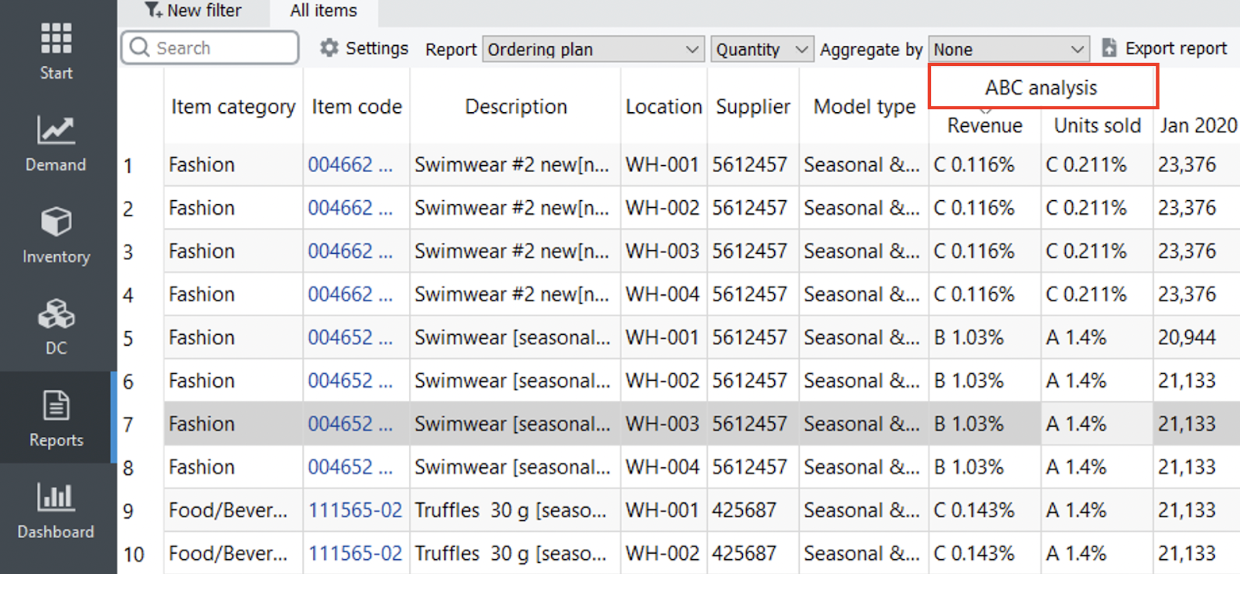
In the case of the two-dimensional analysis, the ABC analysis column has two sub-columns with an indication of the criteria used. There are two criteria in our example, the revenue, and quantity of sold units (see figure below).
A result of ABC analysis can be also viewed on the Demand forecasting tab. To show it, check the ABC analysis option at the bottom of the Tree view. This will add the ABC classification under the All items node of the tree (see figure below).
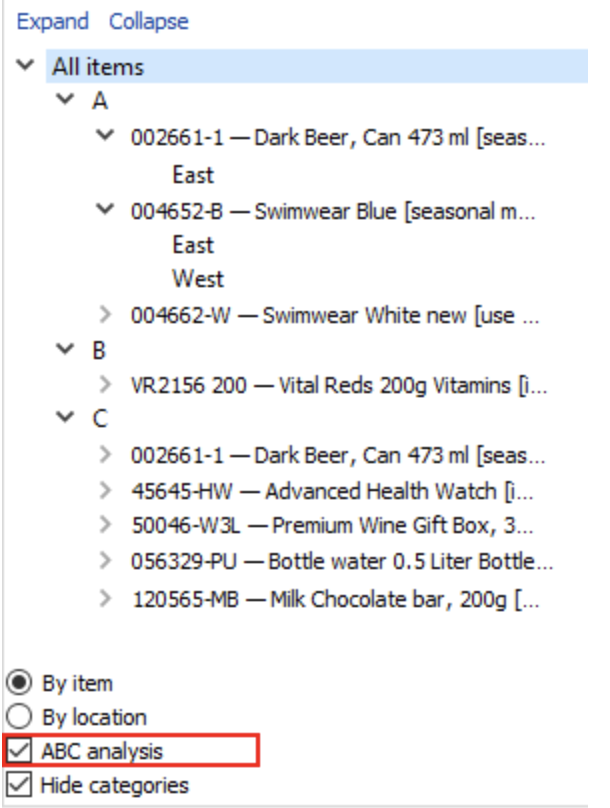
The Hide categories option below the ABC analysis check-box is very handy in this case. It allows you to hide all the categories and sub-categories of your items so that the tree shows only planning items and corresponding ABC classes.
If you use two criteria in ABC analysis, the Tree view shows only the resulting combinations of classes. In our example, the BA and BC combinations are absent because they don’t have items with those combinations. The first letter of the combination relates to the Criterion 1 and the second, to the Criterion 2 (see figure below).
The ABC analysis option in the Tree view also results in showing the ABC column in the inventory report as shown by clicking the Inventory planning tab (see figure below).
All the ABC analysis reports can be exported to Excel files. To export a report, click the Export report button on the toolbar of the corresponding tab (Demand forecasting or Reports).
To hide the ABC analysis:
ABC analysis is calculated on a yearly basis. Thus, data of the last twelve months are used in calculations. The assignment of an item to a particular class (A, B, or C) is made based on the criterion value calculated for this item. Items having higher criterion values belong to class A, those which have a lower value are assigned to class B, and so on. There are five types of criteria:
In the next sections, we will concentrate on how these criteria are calculated depending on the available data.
The unit-based criterion value is the annual volume of sales of an item.
Calculation of the revenue-based criterion differs depending on the provided data via the Streamline’s data connection.
Aggregated spreadsheet connection
The revenue-based criterion value is the sum of the revenue over the last twelve months if the revenue history is imported from an Excel file directly. If the history length is not sufficient, Streamline calculates the criteria based on the averaged monthly revenue.
The revenue-based criterion value is the product of the current selling price and the annual amount of sold units if the current selling price of an item is provided instead of the history of the revenue.
Transactional spreadsheet connection, Database connection or 3-rd party systems
Depending on the data you provide, the criterion is calculated as:
Cr = Sumyear(sales_price/unit * qty_sold) or
Cr = Sumyear(sales_price/order).
Where:
Sumyear() is the sum of all the transactions over the last year; qty_sold is the amount of an item sold in a transaction.Calculation of the gross profit-based criterion differs depending on the provided data via the Streamline’s data connection.
Aggregated spreadsheet connection
Streamline allows you to import the inventory value/unit, inventory value, or the item purchase price. Streamline's calculations use one of these. Let’s denote the criterion Streamline uses of imported from this set as item_value. Then the formula for the ABC analysis criterion is:
Cr = Sum12months[(avg_sales_price/uniti - item_value) * qty_soldi],
where:
Sum12months[] is the sum over the last twelve months;avg_sales_price/uniti is the selling price of one unit of an item averaged over the i-th month; andqty_soldi is the amount of an item sold in the i-th month.
When the inventory value is used, item_value is calculated as:
item_value = inventory_value/on_hand.
The on_hand value is the item quantity currently on hand.
Transactional spreadsheet connection, Database connection or 3-rd party systems
Depending on the data you provide, the criterion is calculated as:
Cr = Sumyear[(sales_price/unit – item_value)* qty_sold] or
Cr = Sumyear(sales_price/order – item_value * qty_sold).
Where:
Sumyear() is the sum across all transactions during the last year;qty_sold is the amount of an item sold in a particular transaction;sales_price/unit is the selling price of one unit of an item in a transaction;sales_price/order is the sales transaction price of an item; anditem_value can be either the inventory value/unit or the item purchase price, depending on what you provide.Calculation of the COGS-based criterion differs depending on the provided data via the Streamline’s data connection.
Aggregated spreadsheet connection
Streamline allows you to import the inventory value/unit, inventory value, or the item purchase price. Streamline's calculations use one of these. Let’s denote the criterion Streamline uses from this set as item_value. Then the formula for the ABC analysis criterion is:
Cr = Sum12months(item_value * qty_sold_i).
Where:
Sum12months() is the sum over the last 12 months; andqty_sold_i is the amount of an item sold in the i-th month.
When the inventory value is used, item_value = inventory_value/on_hand. The on_hand value is the item quantity currently on hand.
Transactional spreadsheet connection, Database connection or 3-rd party systems
The criterion value is the product of the inventory_value/unit and item amount sold for the last year.
The criterion value is either:
inventory_value/unit * on_hand, or item_purchase_price * on_hand,depending on the type of data you provide.
 Manage book (
 Help
Help