User Guide
1. Streamline Client
2.Streamline Server
3. Starting Up
4. Connecting data
5. Demand and Sales Forecasting
6. Inventory Planning
7. Reference
1. Streamline Client
2.Streamline Server
3. Starting Up
4. Connecting data
5. Demand and Sales Forecasting
6. Inventory Planning
7. Reference
 Add this page to your book
  Remove this page from your book
 Streamline uses time series decomposition, intermittent demand models, and a human-like decision-making algorithm that selects the right model for each product. Our approach is highly resistant to over-fitting. It doesn't try to fit irregular demand, but at the same time, it is able to capture all clearly observed dependencies such as seasonality, trends, and level changes. Streamline aims to pick the simplest model that still captures dependencies in the data that is the only way to produce an accurate forecast. A trade-off between model simplicity and data fit finally results in the highest possible accuracy.
Despite the fact that there's a variety of demand forecasting tools on the market, we observe only two approaches to statistical forecasting of demand. Time series decomposition and model championship. The first one tries to understand the data (some algorithms are smarter than others), while the second one picks the best-fit model. Unfortunately, the second approach doesn't care about capturing underlying patterns from the demand. While most leading vendors have already implemented an in-depth time series decomposition in their tools, just like Streamline does, there are enough laggers who still promote outdated championship technique that over-fits. Just be aware of that.
Analysis of demand data starts with removing spikes caused by pre-orders, adjusting for stockouts and holidays, and finding the relevant history depth. Then, Streamline decomposes demand into level, trend, and seasonality.
The formula for the time series model is (Slope*Time + Level)*Seasonality*Adjustment.
Streamline automatically decides which subset of model components is beneficial for each planning item. So the model can be just the Level, Level*Seasonality, or (Slope*Time + Level). Streamline allows manual selection of models as well.
Here is an example of how a Constant level model differs from the Trend model and Seasonal model:
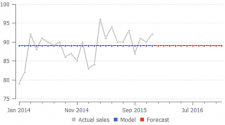
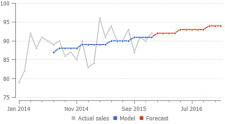
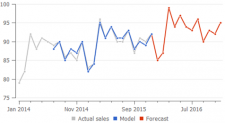
Streamline's secret sauce is an algorithm that finds the relevant depth of history that is used to estimate the trend component of the model. While the calculation of seasonal coefficients uses all non-zero values in the history anyway. 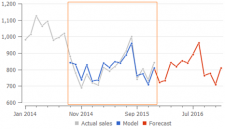
Product launch data or just very old sales are not relevant to the current business situation and projecting that into the future leads to inaccurate forecasts. But Streamline narrows the period of time that is fitted by the model and captures the trend only from the relevant part of the data. In the example that is shown in the plot on the right, Streamline calculates trend parameters using only the data in the orange rectangle.
Spikes and dips in the sales often make data analysis desperate and ineffective. If no seasonality detected, Streamline removes outliers within 1.5% tails of the gamma distribution.
A period that has more than 70% stockout days is treated by Streamline as unreliable. Its data is not taken into account when Streamline generates forecasts for this item.
If a period has stockouts and the number of stockout days is more than 30% of the period, the demand in this period is increased proportionally to the number of stockout days before creating a model. For example, if a period has 30% of stockout days, then the adjusted demand is actual_demand / 0.7.
The intermittent demand model is applied if demand appears at random, with many periods having no demand. This demand pattern is sometimes referred to as lumpy, irregular, random or sporadic.
Streamline calculates the probability of demand occurrence, median demand, and the deviation of the log-normal model. Based on that Streamline finds appropriate safety stock levels, while expected demand is equal to zero all the time.
 Manage book (
 Help
Help