User Guide
1. Streamline Client
2.Streamline Server
3. Starting Up
4. Connecting data
5. Demand and Sales Forecasting
6. Inventory Planning
7. Reference
1. Streamline Client
2.Streamline Server
3. Starting Up
4. Connecting data
5. Demand and Sales Forecasting
6. Inventory Planning
7. Reference
 Add this page to your book
  Remove this page from your book
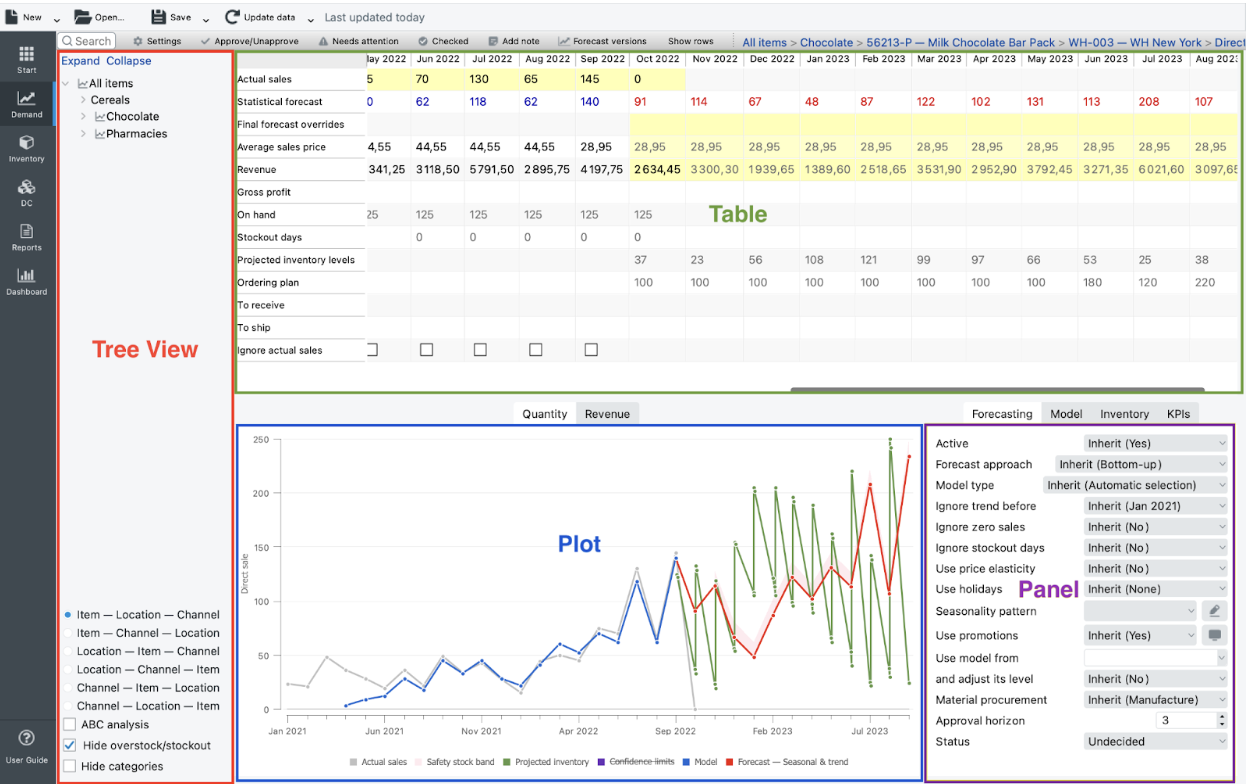
 Once you have created a new project, Streamline automatically generates and shows the total forecast in the Table and Plot (see figure below). The forecasts are shown in red in the Table and Plot.
The Tree view on the left is used to browse through your data hierarchy and see the forecasts and other information at a particular level. As soon as you select a node in the tree, the Table, Plot, and Panel get updated immediately and show the corresponding information at that level.
Below, we describe:
By default, Streamline continuously re-forecasts the project when you:
Streamline shows unit and revenue forecast for the currently selected tree node in the Table and on the Plot.
The unit forecast is presented by red numbers in the Statistical forecast row of the Table and by red points in the Plot.
The Bottom-up forecasting approach is used by default to build models for all nodes of the tree. It implies that forecasts on higher levels of the tree are calculated based on the forecast of lower levels as a simple sum, starting from tree leaves. Tree leaves are standalone models calculated based on imported sales history.
The Statistical forecast row of the Table shows values in blue and red colors at a leaf level (see figure below). Blue numbers are the model fit at the learning set (actual data), while the red ones are the forecasts.
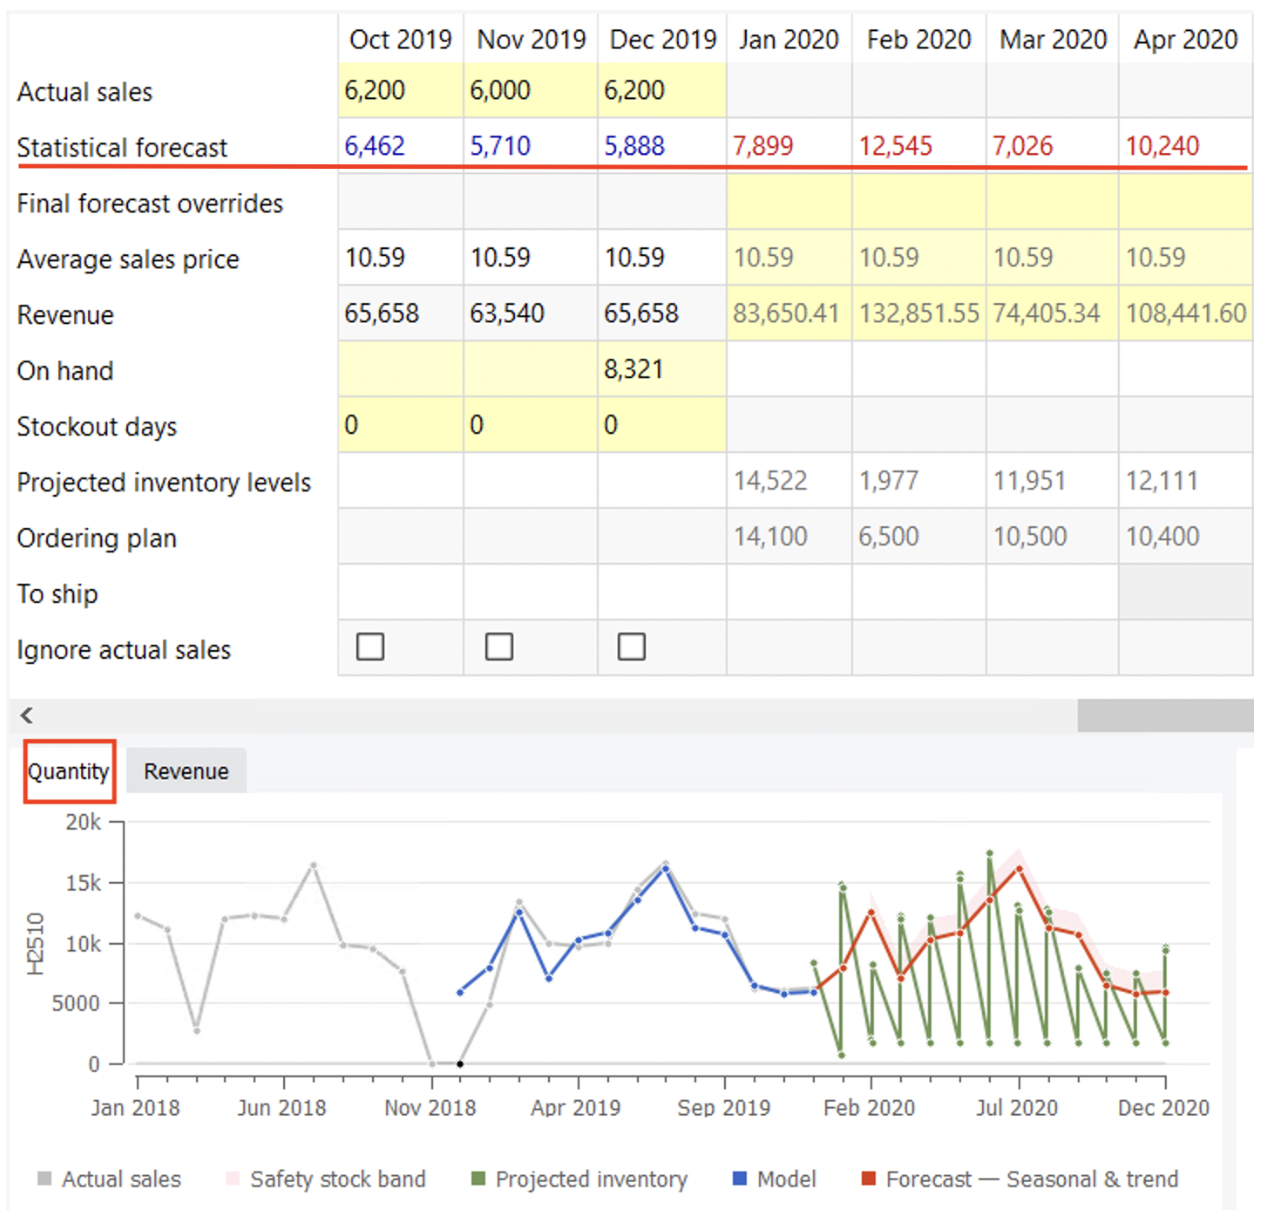
Legend of the Plot also indicates the model type used to forecast the data. It is a Seasonal & trend model in the case in the figure.
To view the forecasts in detail graphically, the Plot supports such manipulations as zooming a particular area and panning the plot in the zoomed scale.
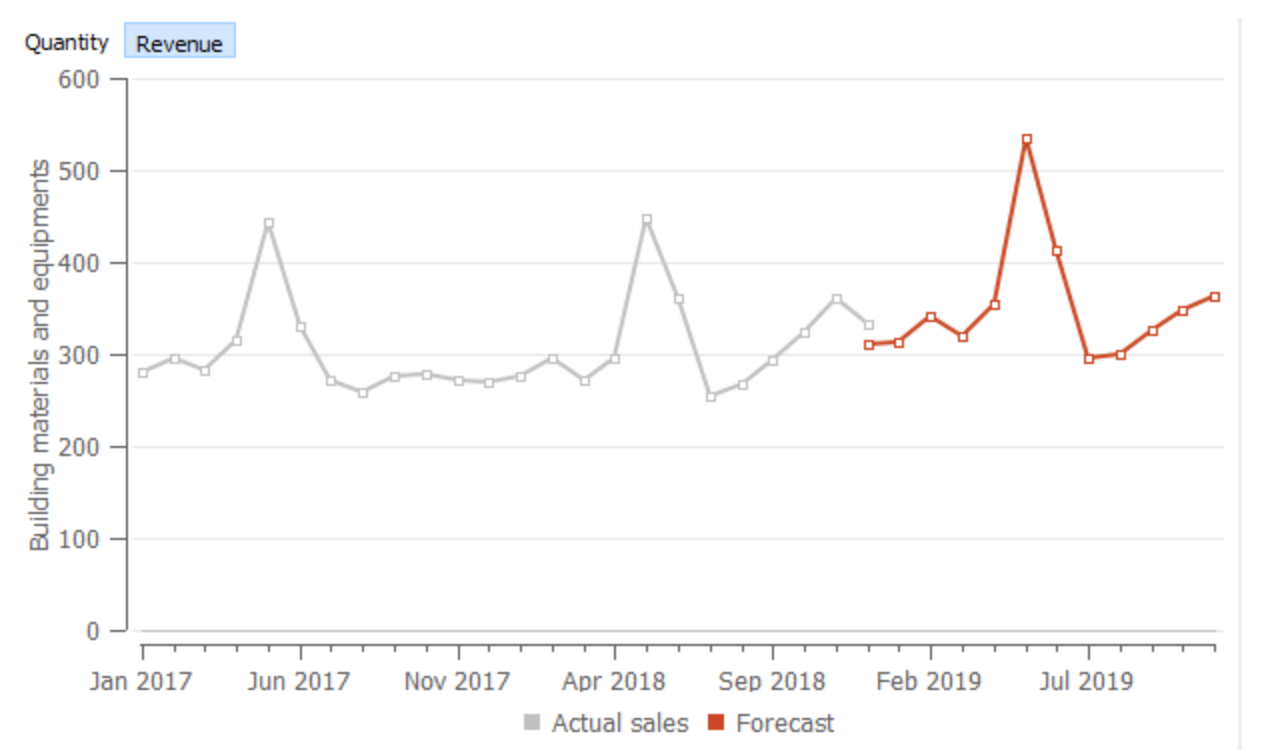
Streamline shows revenue forecast only if current sales price or price of sales transactions was imported. The Revenue row of the Table shows the numeric revenue forecast for the forecasted periods (see figure below).
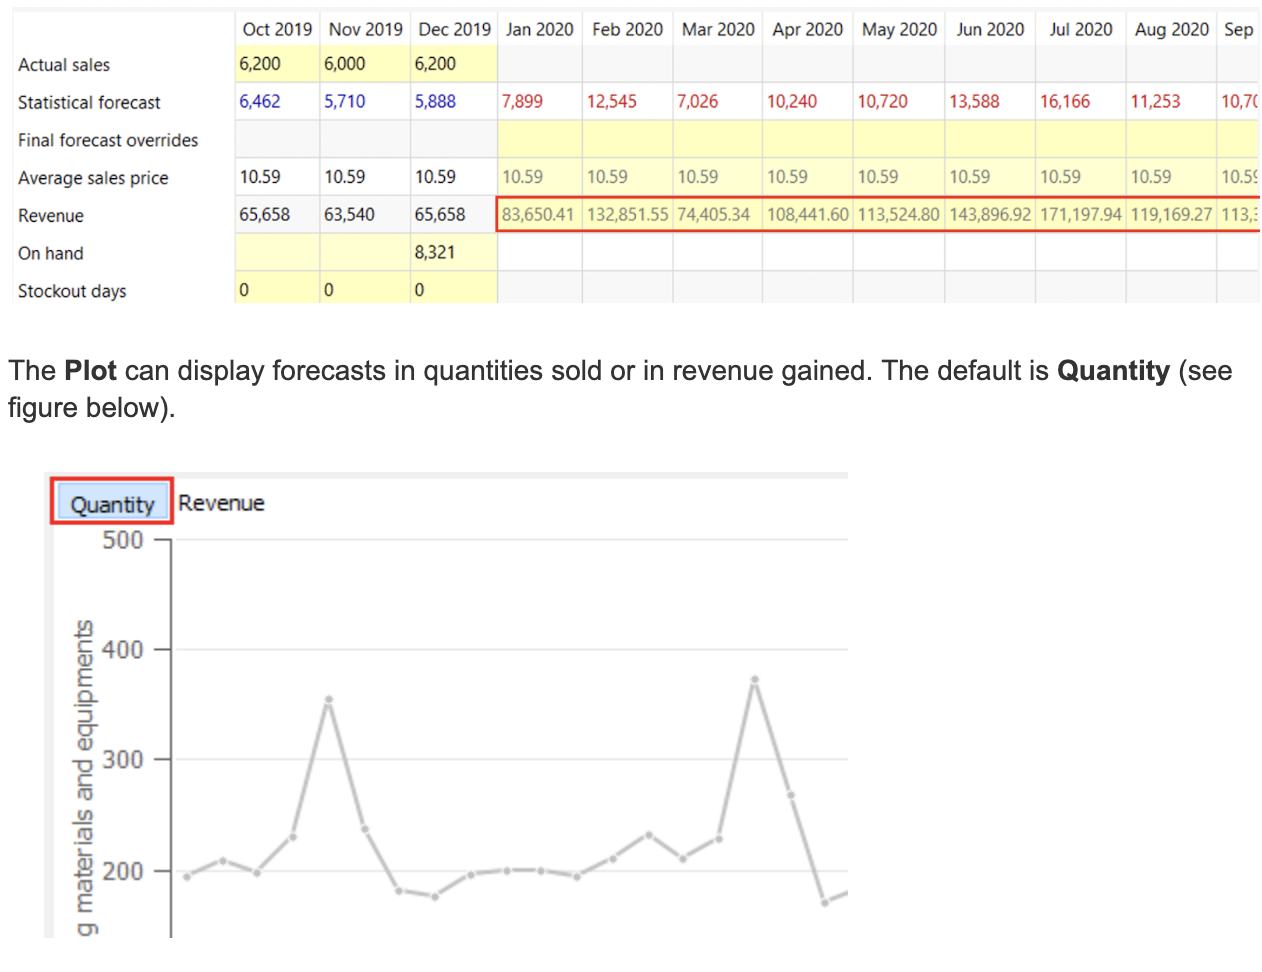
The Plot can display forecasts in quantities sold or in revenue gained. The default is Quantity (see figure below).
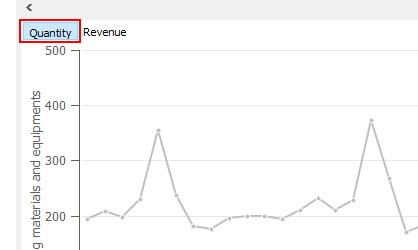
To switch to the revenue mode, click the Revenue button over the plot (see figure below).
Streamline represents the data you have imported as a hierarchy tree in the Tree view. This hierarchy is composed of:
depending on the available data and its configuration. The options at the bottom of the Tree View help you to find out which data dimensions are available to view and choose the appropriate view.
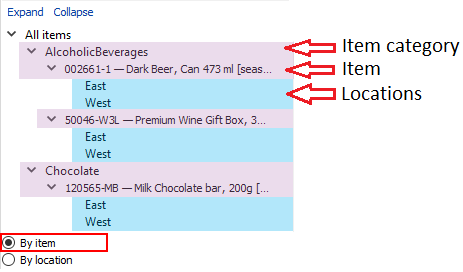
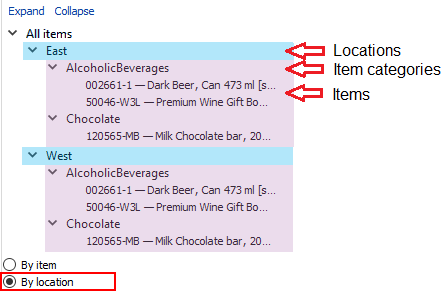
If you import locations or channels additionally to items, the Three view shows two viewing options:
Here is a description for these options:

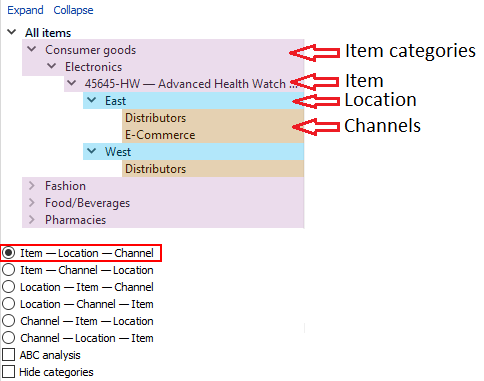
If you have all three types of data imported (item, location, and channel), Streamline displays six different viewing options that allow you to see your data using all available viewing combinations. These are:
Streamline generates forecasts based on a set of given settings. The forecasting model built using these settings is shown in the Model tab of the Panel. There are three ways to change the automatically generated forecasts:
Streamline has a lot of forecasting settings. Each of them was specifically designed to be of help in a particular situation. All of the forecasting parameters are on the Forecasting tab (see figure below). They can be applied at any level of the Tree view tree.
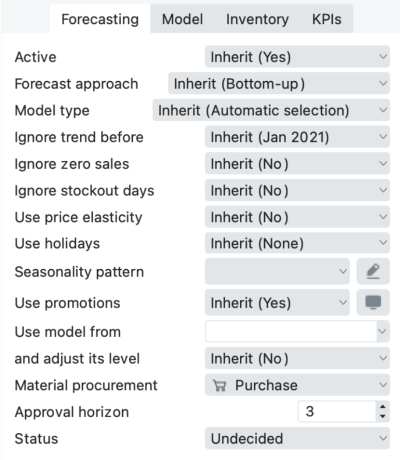
Most of them have the Inherit option set by default. It means that the option of its parent node will be applied to the currently selected node. Information in parentheses shows the option inherited from the parent.
The table below shows the cases, the forecasting parameters, and the options for these parameters.
| Case | Parameter | Option |
|---|---|---|
| New product forecasting | Forecast approach | |
| Use model from | Item code of the borrowed model | |
| Seasonality pattern | Create a new pattern from scratch or create a pattern based on existing item code | |
| Accounting for lost sales | Zeros are lost sales |  Yes Yes |
| Accounting for calendar events | Holidays | Calendar of your country |
| Accounting for recent changes in the sales history level | Ignore data before | The data will be ignored prior to the selected Date |
| Adjusting the model type | Model | The model type |
| Material requirements planning | Bill of materials use | Use Purchase or Manufacture option depending on how you acquire your product(s) |
| Discount promos | Use promotions | Feature considers promotions imported from the data source. As for now, Streamline supports only percentage discount promos, and for the feature to work, you need to have at least one promotion in the past and one for the future period |
| Lock the forecast | Approval Horizon | Feature considers promotions imported from the data source. As for now, Streamline supports only percentage discount promos, and for the feature to work, you need to have at least one promotion in the past and one for the future period |
| Price elasticity influence | Use price elasticity | Feature considers not only qty sold in the past to generate a forecast but also notices the connection between an increase or decrease in sales and price change |
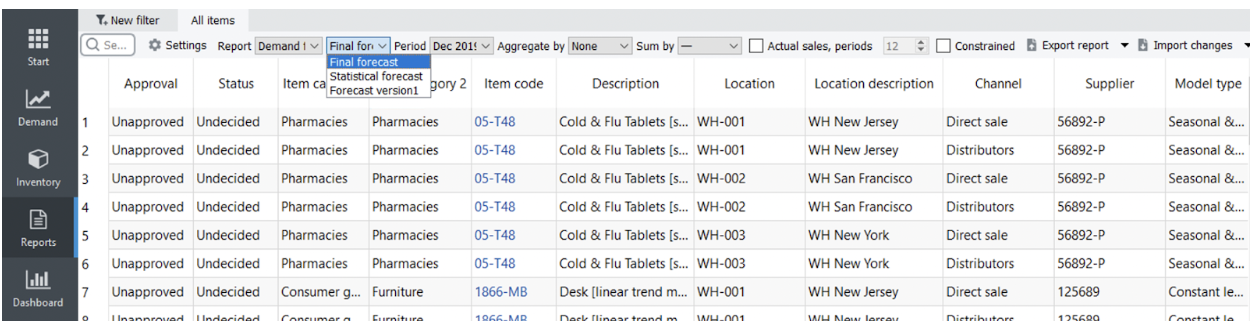
Streamline allows viewing forecasts for all the planning items at once by using the forecast reports. There are three forecast reports in Streamline: Final forecast report, Forecasts adjustments report, and the Forecast accuracy report. To access the reports, go to the Reports tab. To select a report, use the Select report control.
Each report can be exported to Excel by clicking the Export report button. These can then be edited and saved in Excel and imported back into the application using the Import changes button.
Demand Forecast Report
This report may be represented as a ‘Final forecast,’ ‘Statistical forecast,’ or ‘Forecast versions.’
The Final forecast depicts the statistical forecast and any overrides for all the planning items, while in the Statistical forecast, overrides are not displayed.
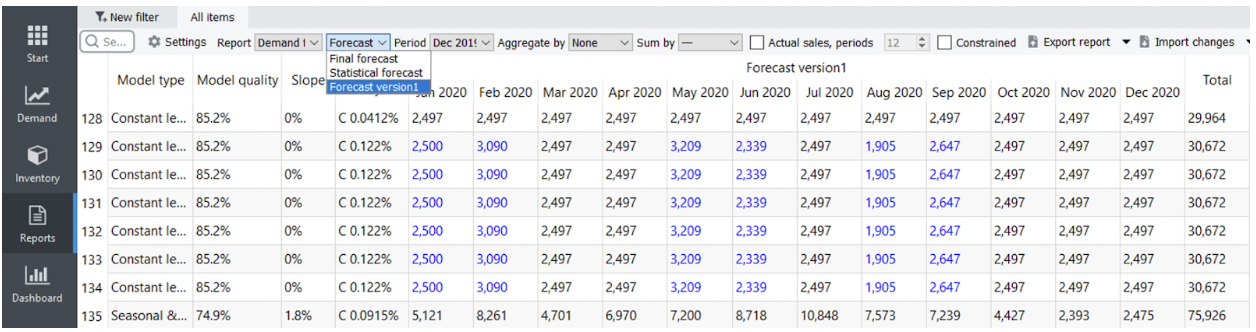
As the Forecast versions feature is designed to have the option to add more rows to the Table for your forecast calculations or alternative forecasts of your colleagues, the Forecast versions report allows you to see the report based on this data. The cells, color-coded in blue, represent the data taken from the Forecast version row in the Demand tab.
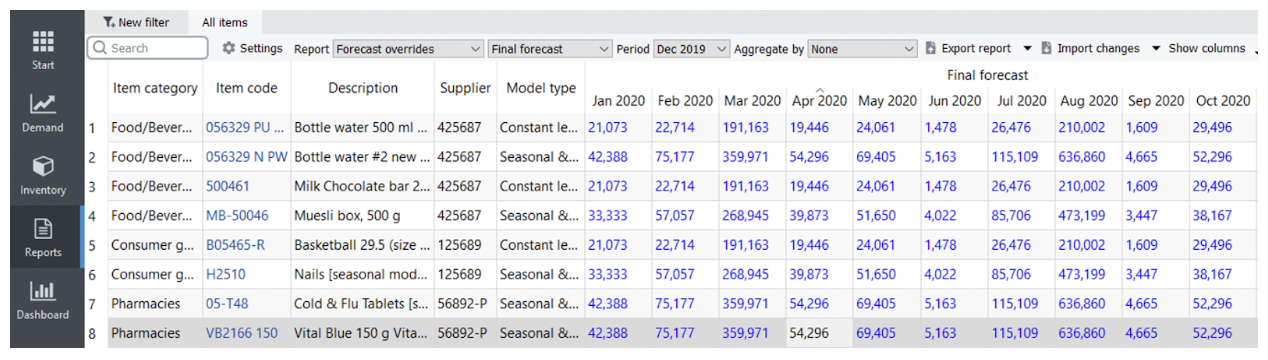
Forecast Overrides Report
This report shows only the forecast adjustments made manually in the Forecast overrides row of the Table view on the Demand forecasting tab. It is useful when you need to ensure that all the adjustments you intended to do were done.
 Manage book (
 Help
Help