User Guide
1. Streamline Client
2.Streamline Server
3. Starting Up
4. Connecting data
5. Demand and Sales Forecasting
6. Inventory Planning
7. Reference
1. Streamline Client
2.Streamline Server
3. Starting Up
4. Connecting data
5. Demand and Sales Forecasting
6. Inventory Planning
7. Reference
 Add this page to your book
  Remove this page from your book
 Explain inventory calculation dialog is designed to show and explain Streamline’s planning process for each planning item. This dialog discovers the simulation modeling behind a purchase, transfer, material requirements, and production plans generated by Streamline. It is especially useful to help understand the planning logic in the following complex cases as:
To open the Explain inventory calculation dialog:
The Explain inventory calculation dialog appears (see figure below).
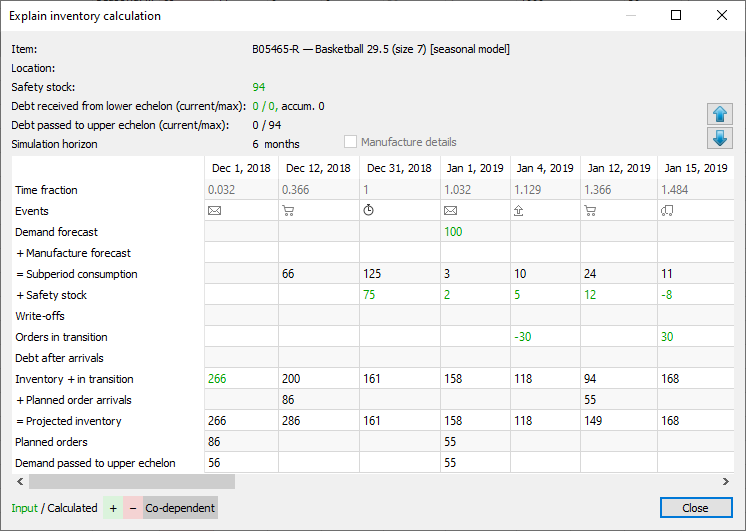
This dialog is divided into two parts. The top part shows the properties of the currently selected planning item. The bottom part, a table displaying events that will happen to the item in the future based on the input data (actual events) and Streamline's simulation modeling (simulated events).
The dialog has its own color-coding helping you understand the math behind the projected inventory levels.

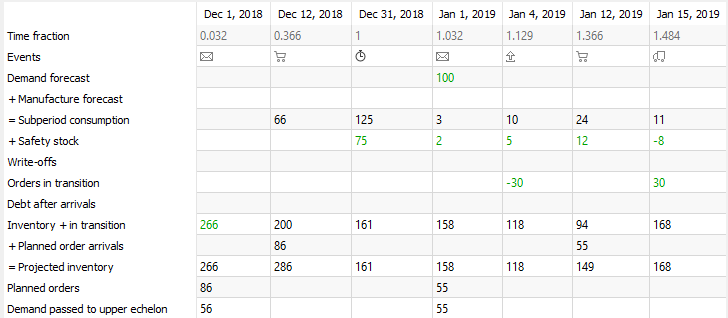
| Icon | Event |
|---|---|
 | Placement of a transfer, purchase, or manufacturing order recommended by Streamline (simulation). |
 | Arrival of the order planned by Streamline (simulation). |
 | Arrival of actual purchase or transfer order. You can view this order in the To receive tab of the In transition details dialog. |
 | Shipment of a sales order. You can view this order in the To ship tab of the In transition details dialog. |
 | Item write-off (simulation). |
 | End of the data aggregation period. |
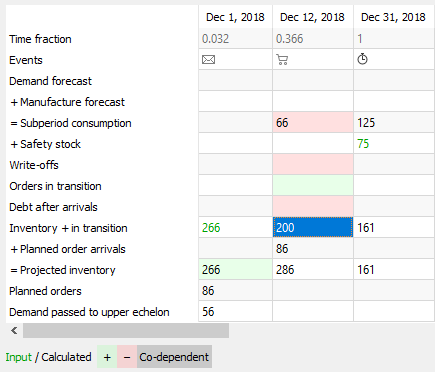
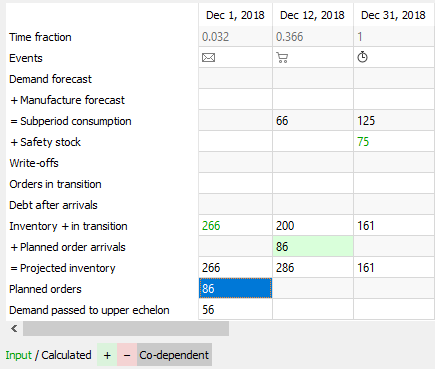
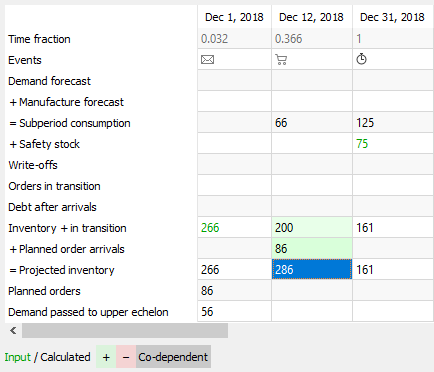
Effective inventory row is displayed in the ‘Explain calculation’ when replenishment strategy in Settings is set to Min/Max.
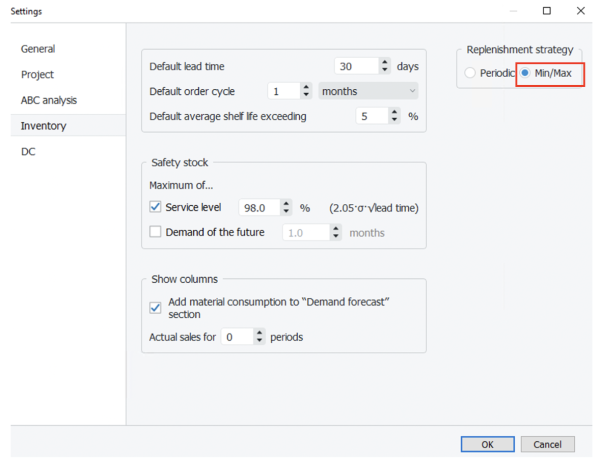
Effective inventory includes into calculation To receive and To ship, which are expected during the lead time. Streamline takes it into account instead of On hand when deciding when an order should be placed.
Buttons with Up and Down arrows on the right of the dialog allow navigating through the planning items.
Manufacture details option expands the table with all the items of the lower echelon which are linked to the current planning item based on the BOMs and shows the manufacture forecast for them.
The color-coding legend for the table is shown in the figure below.

There are three color backgrounds for cells: