User Tools

Site Tools


Sidebar

Go to GMDH home page

Video Tutorials

User Guide

1. Streamline Client

2.Streamline Server

3. Starting Up

4. Connecting data

5. Demand and Sales Forecasting

6. Inventory Planning

7. Reference

program-settings

7.14. Program Settings

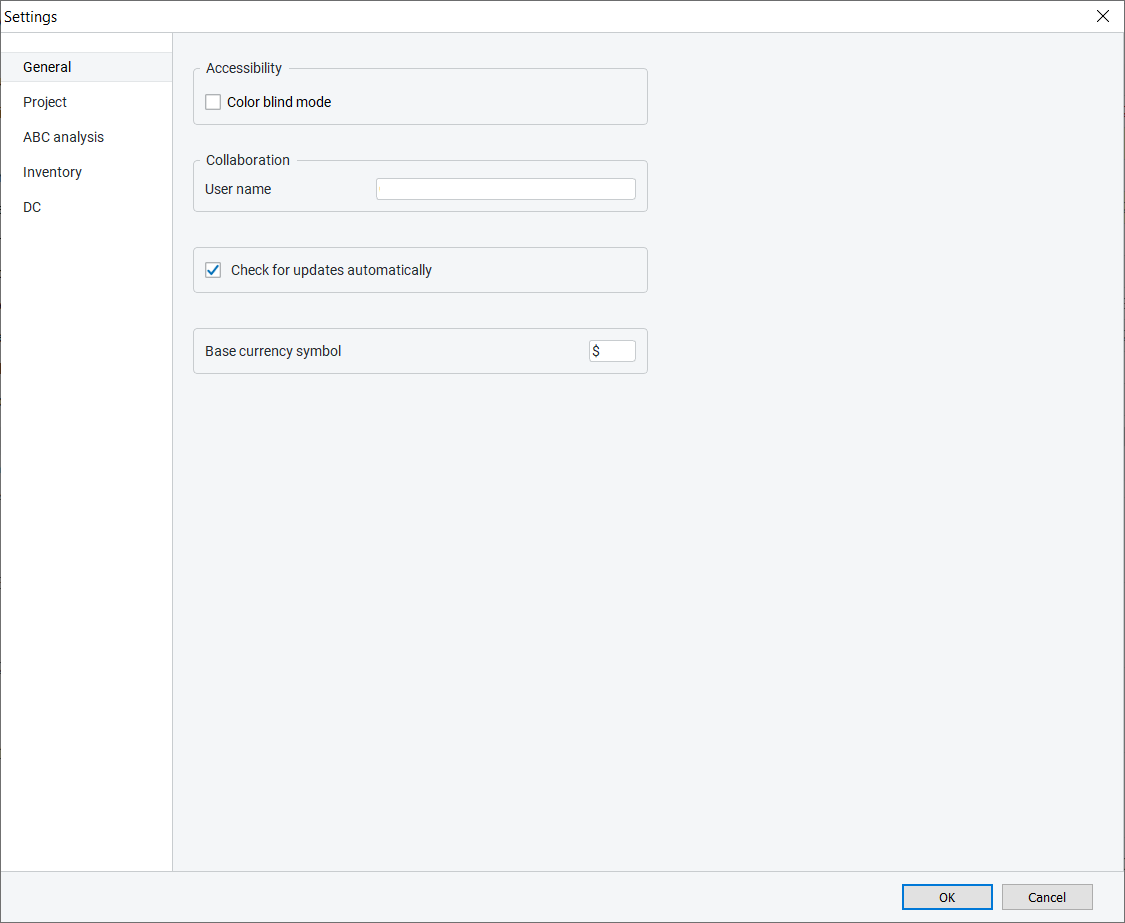
The Settings dialog is used to configure Streamline and the currently open project in particular. All settings are divided into several groups. Each group is located on a certain tab of the dialog. These are:

  • General tab. This tab contains the global settings of Streamline. Those allow setting the user name for Streamline and checking for updates automatically.
  • Project tab. This tab allows you to customize your project across different activities. These include: updating your project, forecasting, inventory planning, and reporting.
  • ABC analysis tab. This tab is used to configure the ABC analysis that is automatically performed for your project.

To open up the program settings, go to the menu File > Settings.

General Tab

The General tab comprises the global settings of the program (see figure below).

  • User name sets the name of the user that is assigned to the notes for adjusted forecasts, or annotations for nodes in the Tree view. The User name field is automatically populated with the information that you provide when activating Streamline.
  • Color blind mode is an option that adjusts colors in Streamline to better distinguish the different elements for people with colorblindness.
  • Check for updates automatically option forces Streamline to check for public updates when it starts.
  • Base currency symbol defines the currency symbol to be indicated for stockouts and overstocks representation in the Tree View.

Project Tab

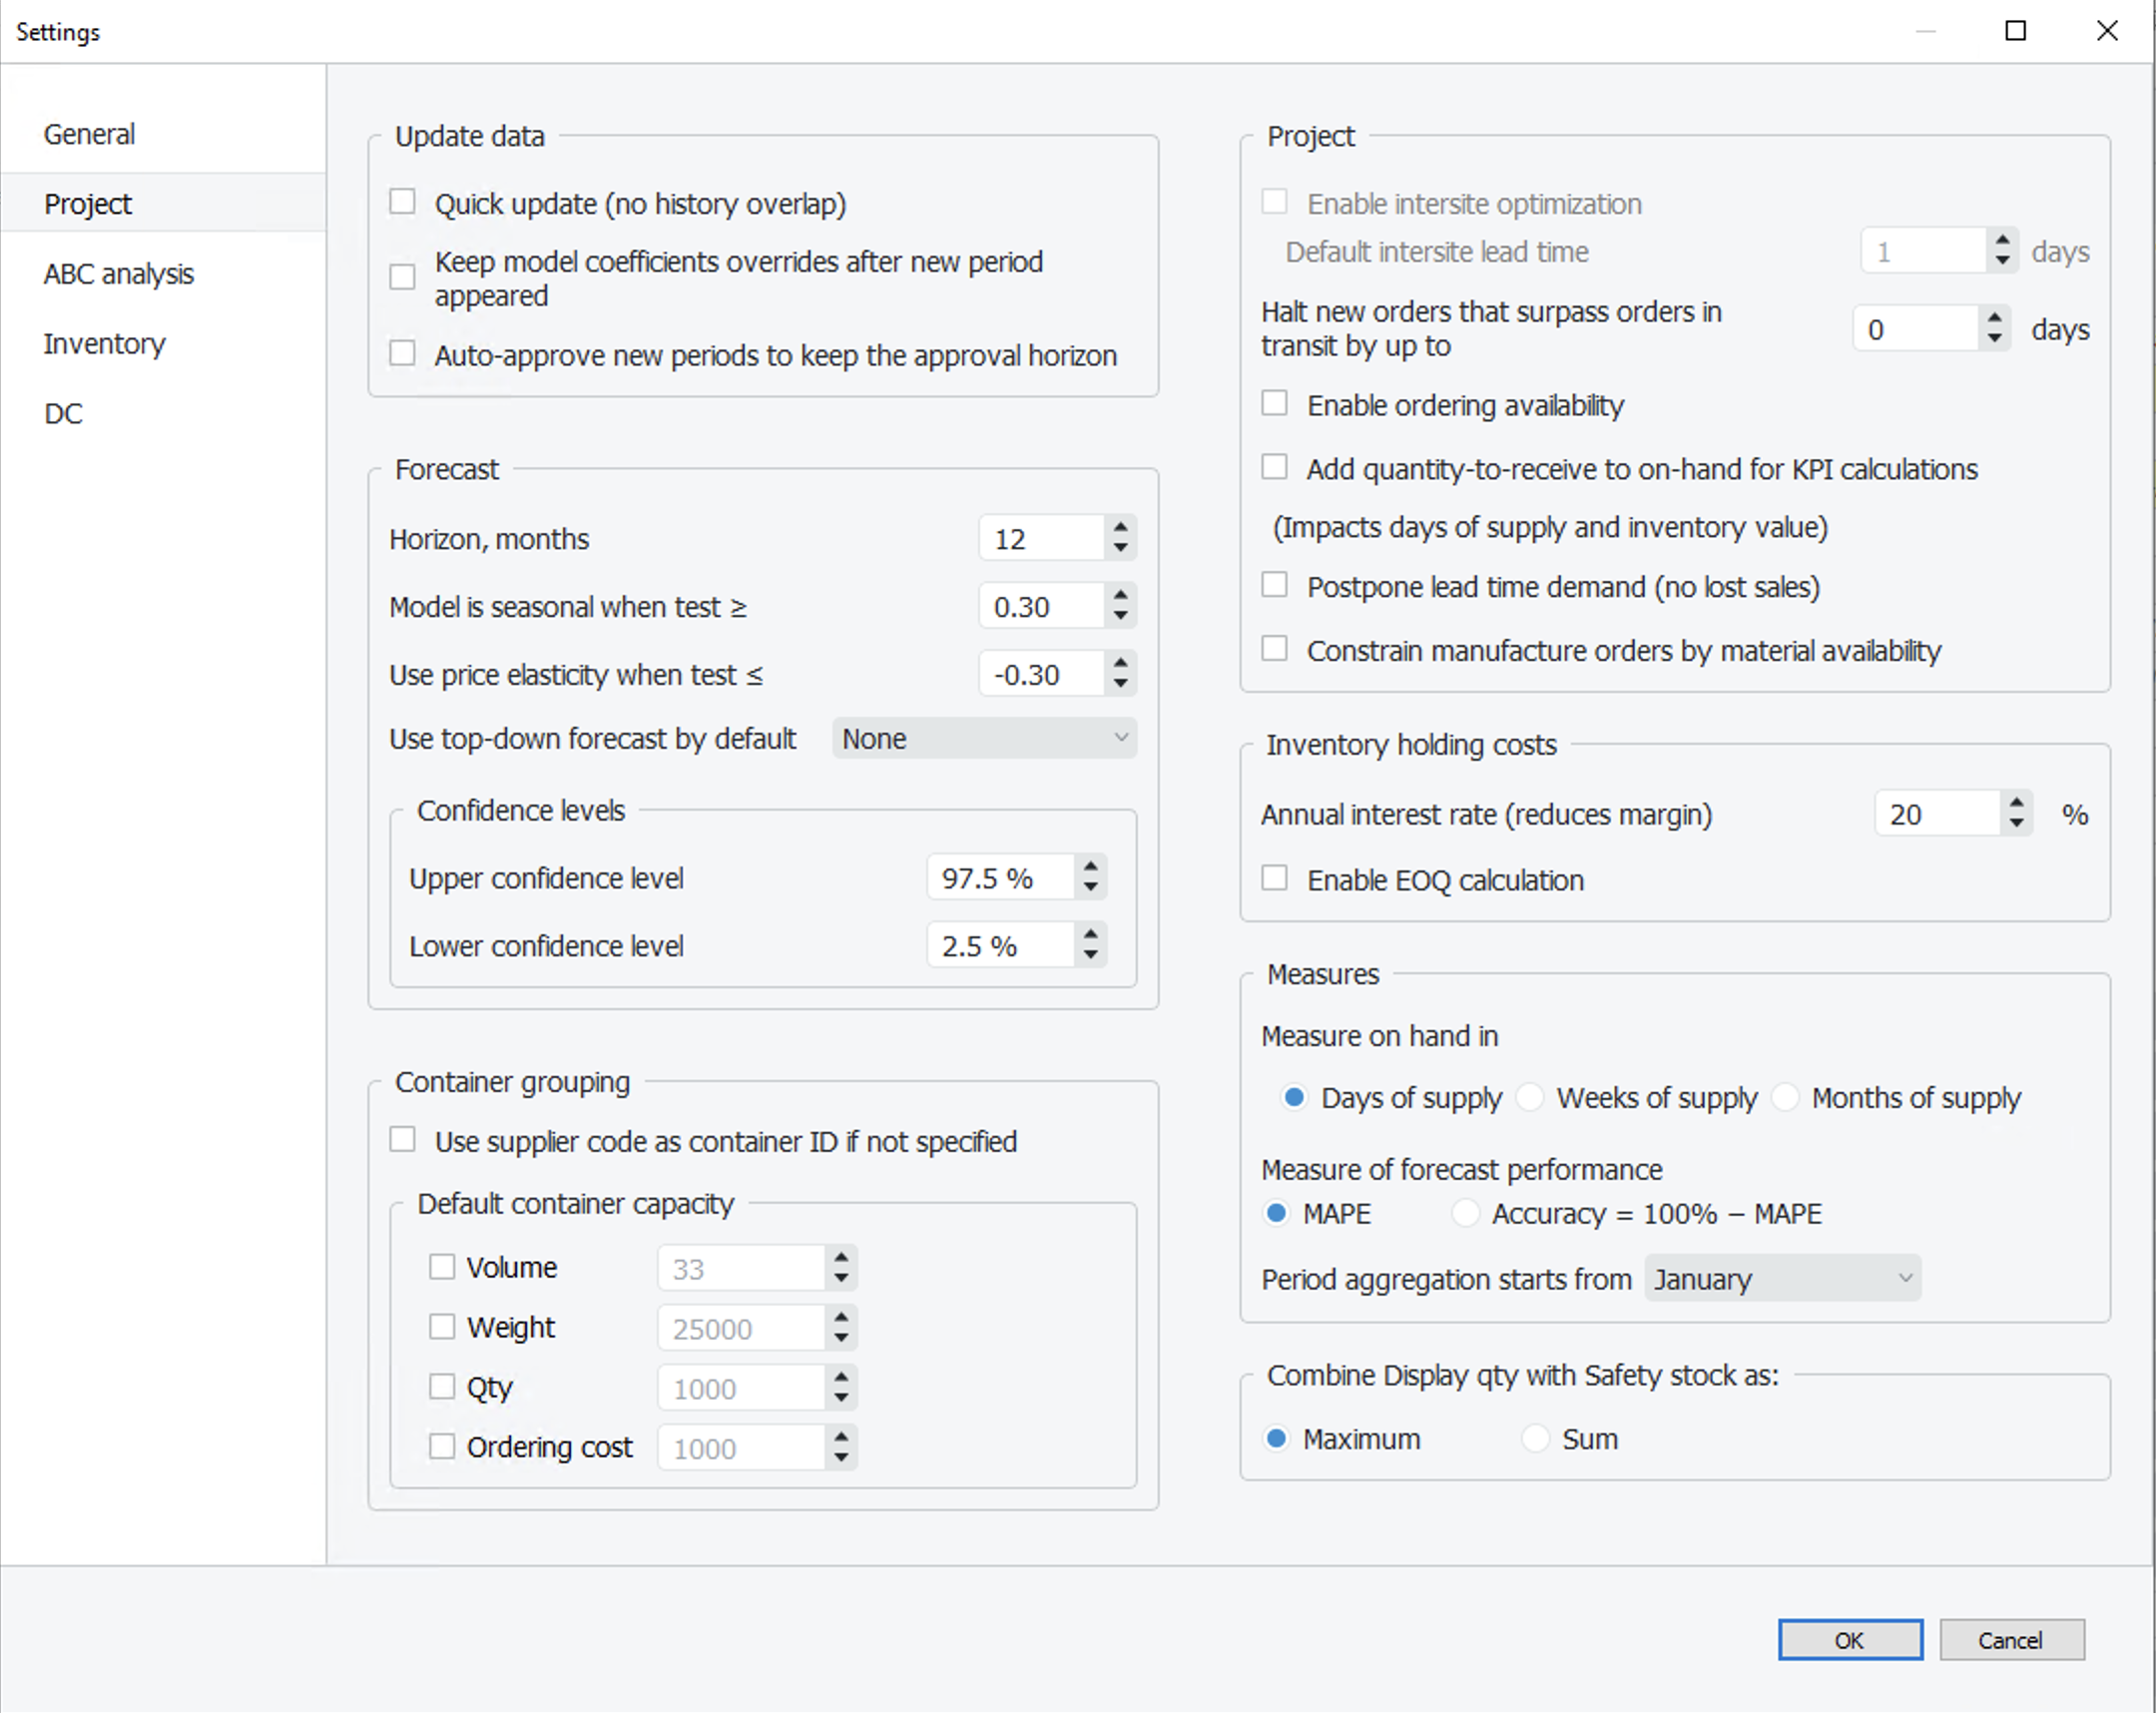
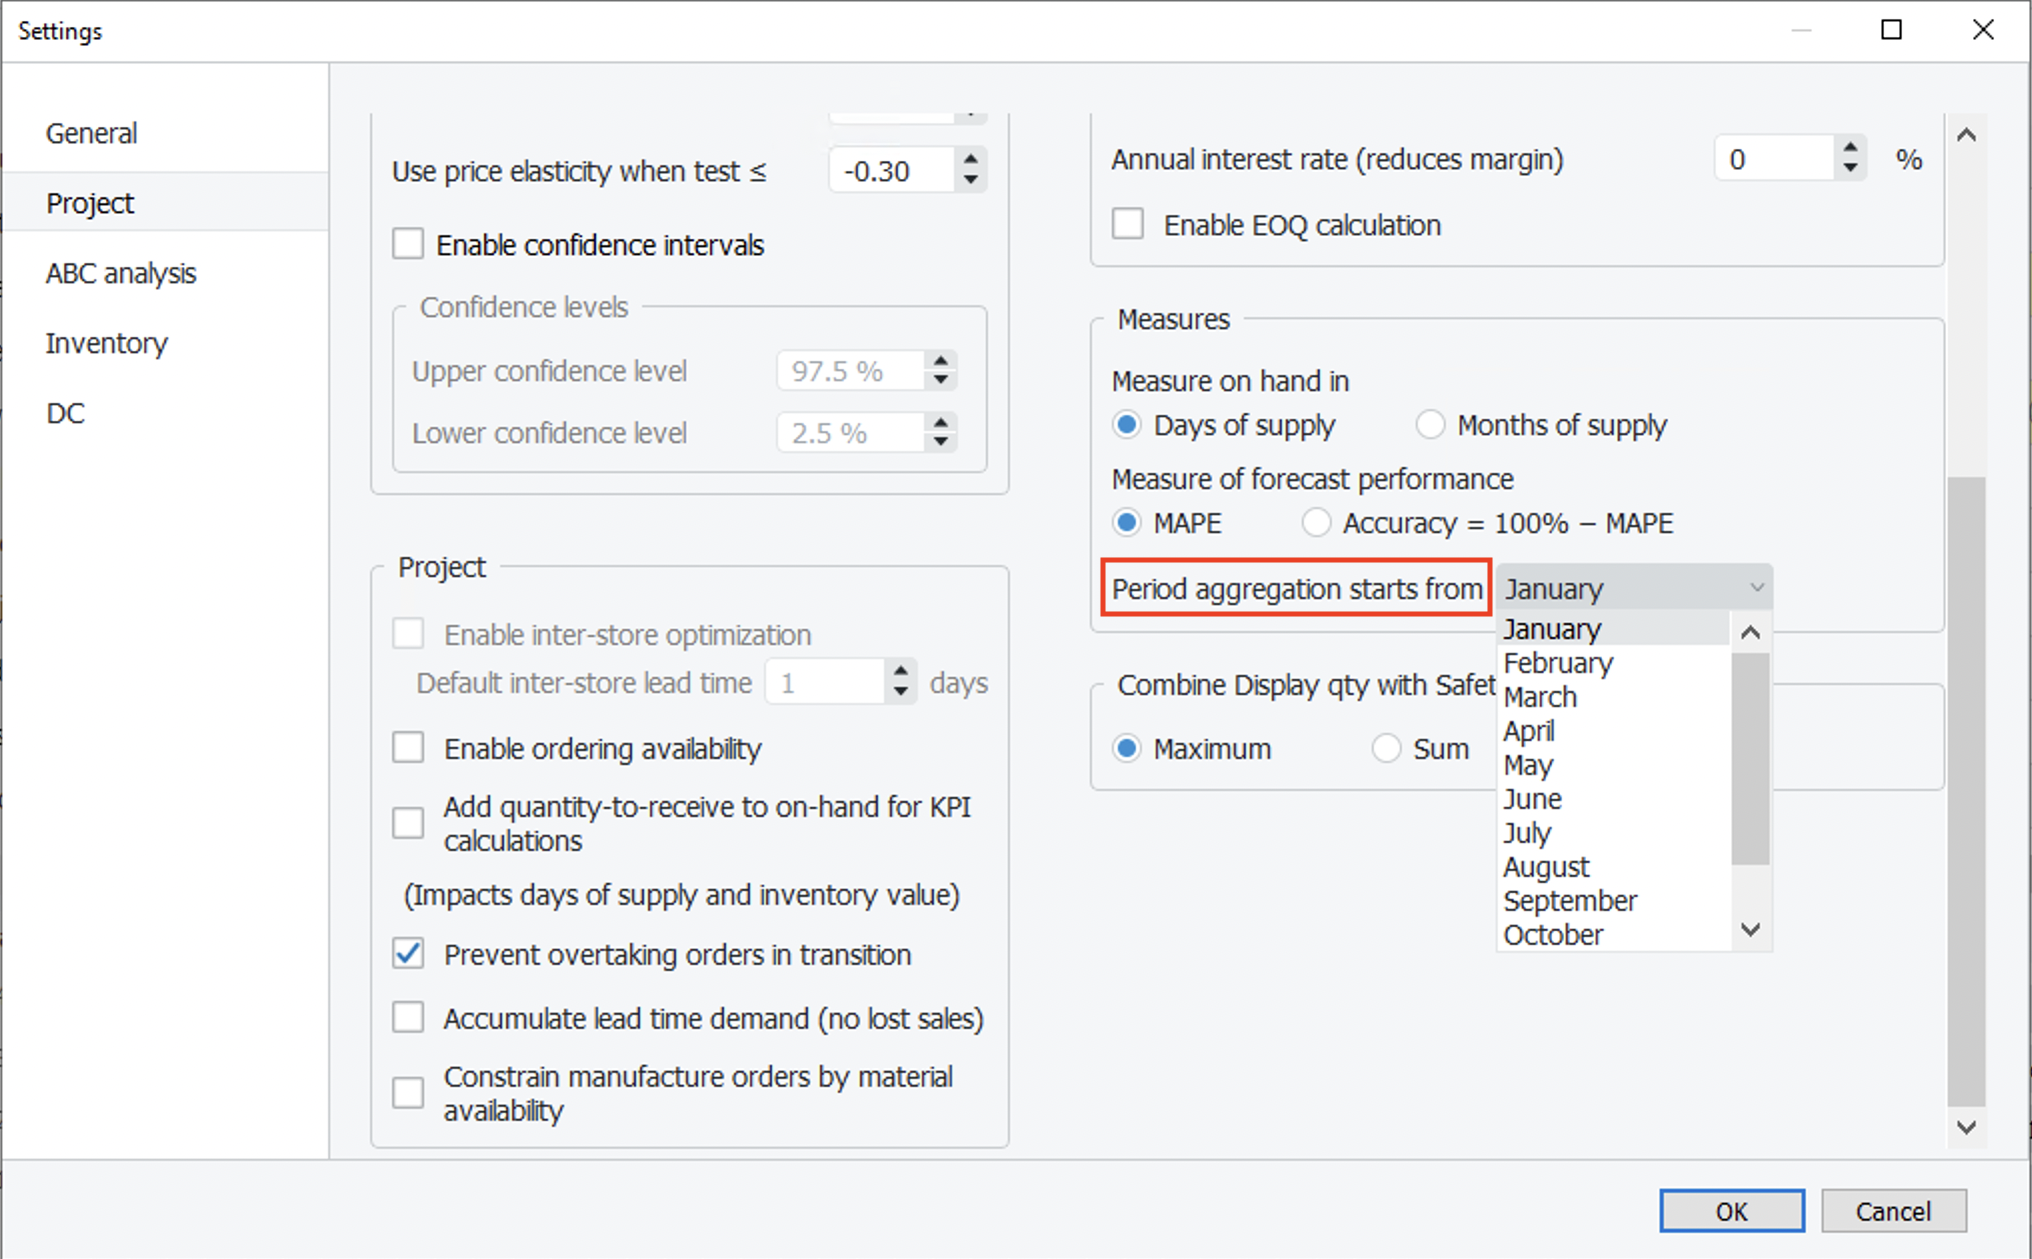
The Project tab contains settings to manage forecast generation, inventory replenishment, and customize reports.

Update data

  • If the Quick update (no history overlap) option is checked the update data command updates only the current period (and missed periods including the current periods if they exist) of the historical data (see figure below).

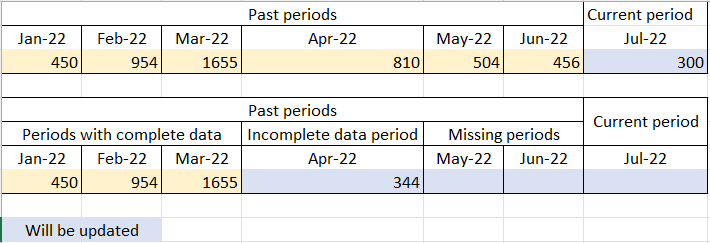
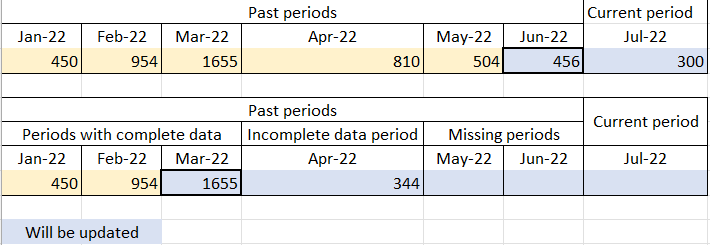
This option is unchecked by default, meaning that Streamline re-imports one period of the data before the latest one with data. Thus, Streamline overlaps by one period of the history when updates your data (see figure below).

The Quick update option is handy when updating your project takes a significant time.
  • Keep model coefficients overrides after new period appeared. Once we enter a new month or week (depending on the project) after the update, model coefficient adjustments will stay in place.
  • Keep approved periods after new period appeared. Once we enter a new month or week (depending on the project) approved amount of periods will roll over to include another time period. E.g. if 5 months were approved, with the unchecked box the next time period only 4 months will stay approved. With the box checked we’ll still have 5 months meaning another month will be automatically approved.

Forecast

  • Horizon, months. Allows setting the number of time periods for which forecasts are generated. The table and plot display these given periods in the Demand Tab.
  • Model is seasonal when test ≥ sets the threshold that is used to decide if a seasonal forecasting model should be used. If the seasonality test has a value that is greater than the threshold, a seasonal model is applied. Calculated seasonality test value for the forecasted item is displayed in the Model tab of the Demand forecasting tab.
  • Use price elasticity when test ≤ sets the threshold that is used to decide if a price elasticity feature should be used. If the test has a value that is greater than the threshold, price elasticity is applied. Calculated price elasticity test value for the forecasted item is displayed in the Model tab of the Demand forecasting tab if the Automatic selection for Use price elasticity feature is chosen.
  • Enable confidence intervals Streamline can show probable forecast variability boundaries called the confidence interval. Two additional lines will appear in the Table and on the Plot (Upper and Lower confidence limit)

Project

  • Enable intersite optimization option enables Streamline to generate transfer orders between your locations. This feature allows you to optimize your inventory due to internal resources and do not order the required amounts from your suppliers or DCs. You can enable this option if you import locations.
  • Default intersite lead time control works in conjunction with the Enable intersite optimization option and sets the default lead time (in days) to deliver a transfer order from one location to another.
  • Enable ordering availability allows you to put constraints on the inventory replenishment process by indicating future periods in which Streamline is allowed to issue orders. This option is enabled if you import on-hand.
  • Halt new orders that surpass orders in transition feature enables users to specify a time frame in days between the Planned order arrival and the expected To Receive and subsequently delay the issuance of the corresponding purchase order.

By default, this setting is disenabled, which means Streamline overtakes orders to receive if a time gap is enough for the arrival.

NB Only the periodic replenishment strategy supports this setting.

  • Accumulate lead time demand (no lost sales). By default, Streamline doesn’t order the replenishment which won’t be delivered in time due to longer lead time compared to how much time we can last with the current on-hand inventory.

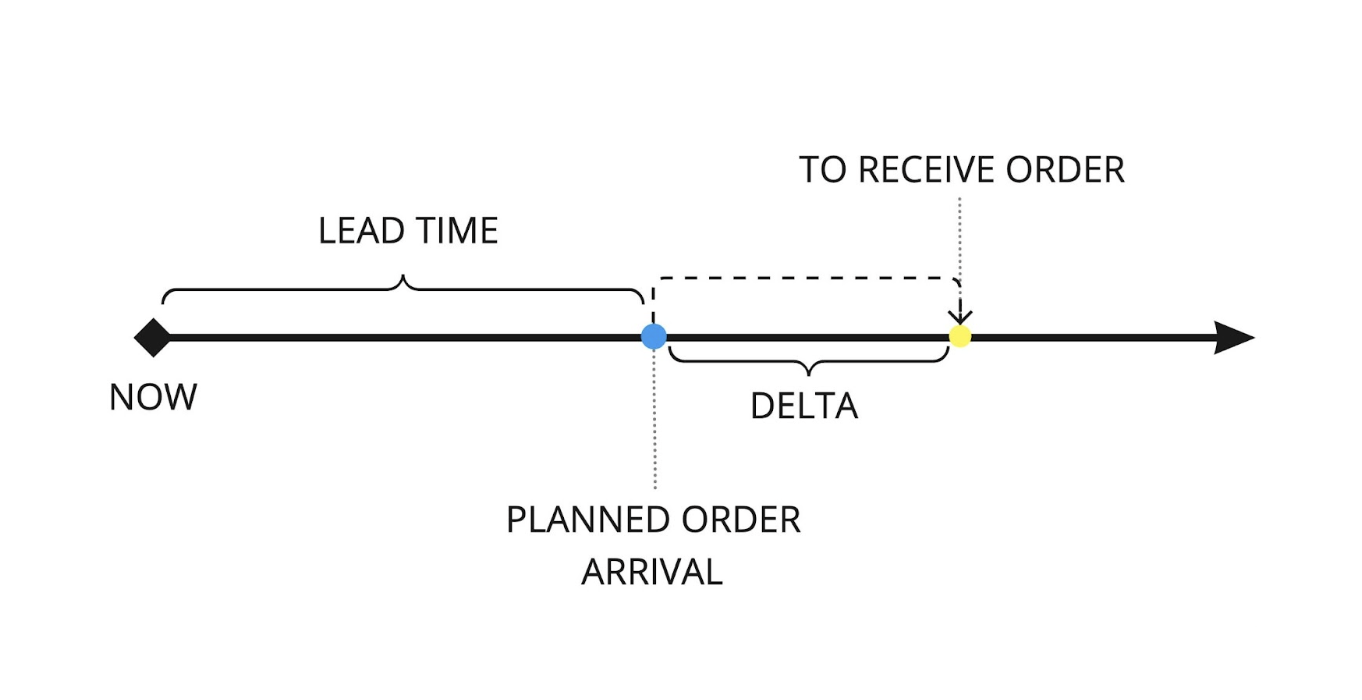
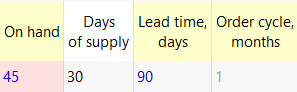
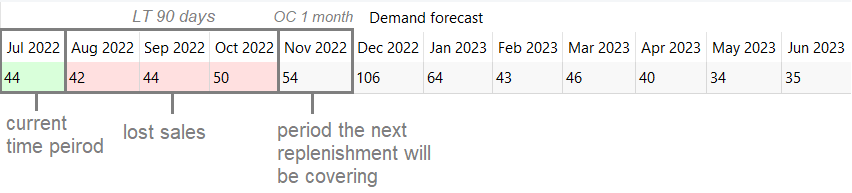
In other words if Days of supply < Lead time, Streamline won’t make up for the lost sales.

If you’d still like to order for the stockout months despite of delay, keep the box checked.

  • Constrain manufacture orders by material availability. If there’re not enough materials on hand to fulfill manufacture order, the MO will be constrained to the amount that is possible to produce.

Container grouping

  • Use supplier code as a container ID if not specified allows to automatically fill in the Container ID field with the supplier code for the item codes in the Inventory tab.
  • Default container capacity allows setting the default values for Volume, Weight, Qty and Ordering Cost for the container in the Inventory Tab.

Inventory holding costs

  • Annual interest rate sets the annual interest rate on loans. It reduces the item Gross margin. If the percentage is not zero, Streamline calulates the gross margin for the current order.
  • Enable EOQ calculation activates Streamline’s ability to balance container filling with holding costs.

Measures

  • Measure on hand in sets units of measure for the indicator that calculates the period of time the current On hand (including orders to ship) can cover starting from the project date. If the Days of supply option is selected, Streamline shows the Days of supply column in the KPIs report and Inventory Tab. Otherwise, the Months of supply column is shown.
  • Measure of forecast performance switches between Error (MAPE) and Accuracy modes in relevant reports (i.e. Forecast performance, Planned vs. Actual sales)
  • Periods aggregation starts from is essentially an option to select a month with which a fiscal year starts in the system.

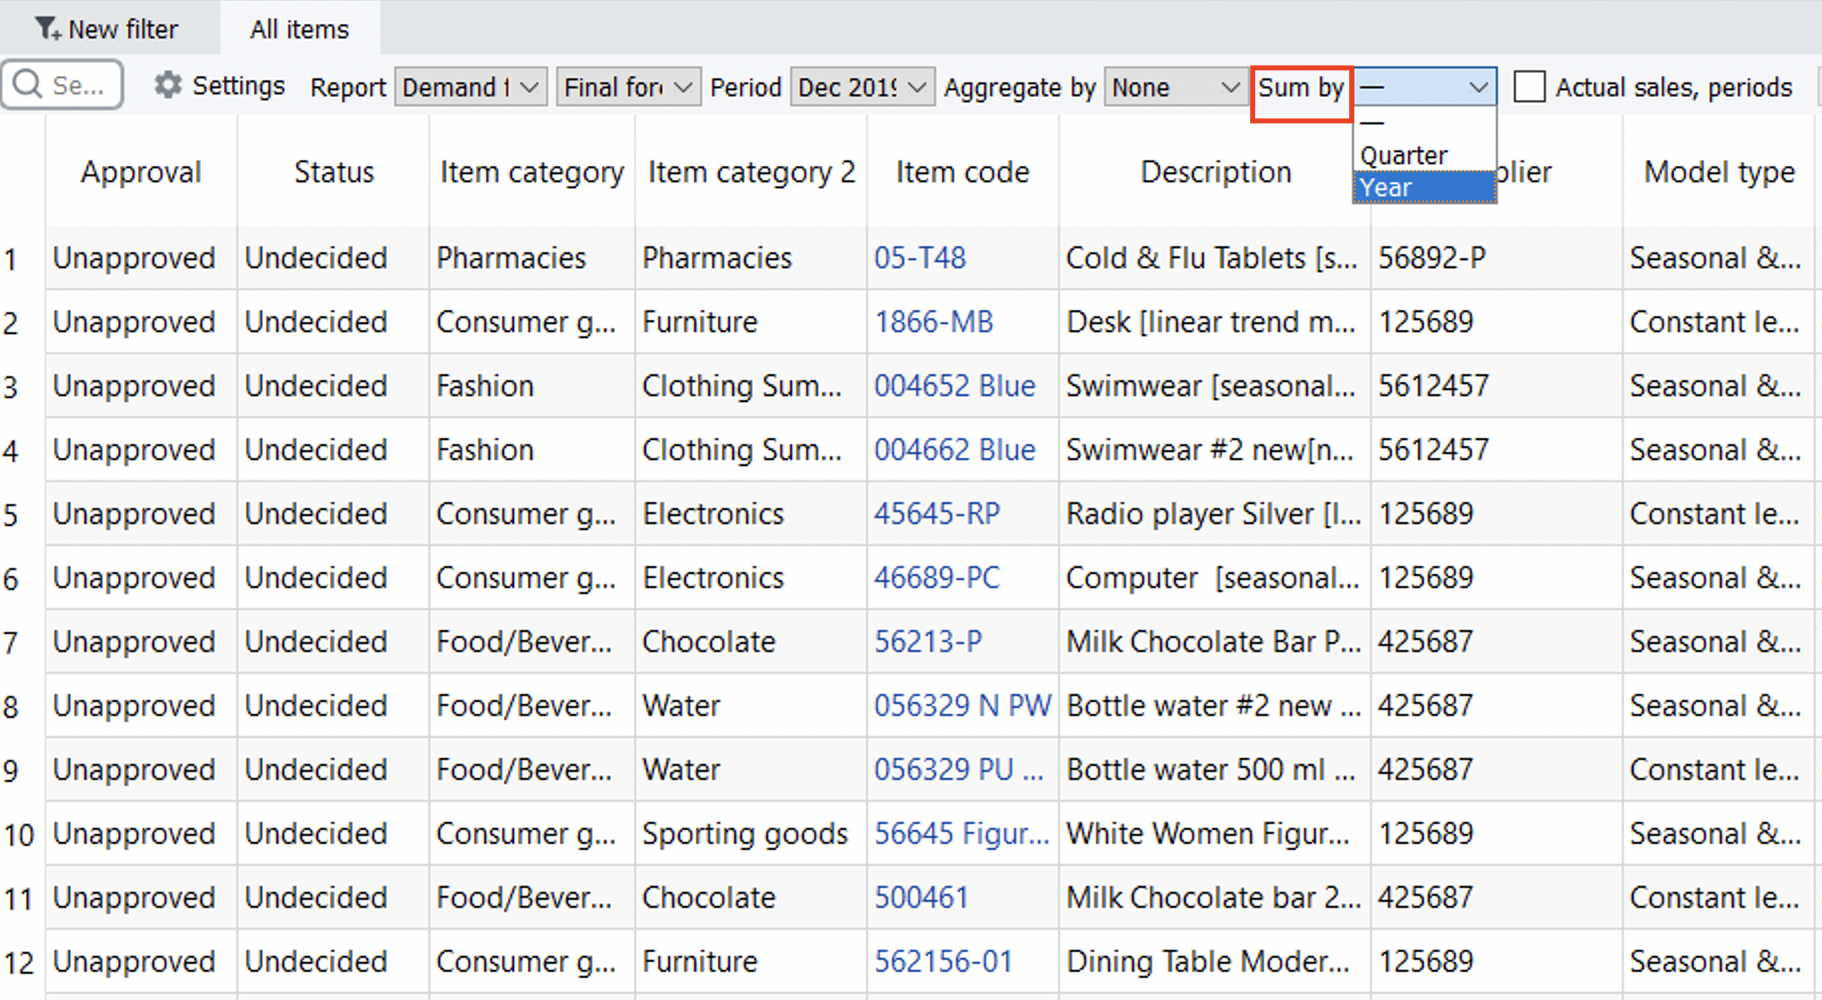
If the Period aggregation starts from option is set to the default value (January) in the Settings, the system simply aggregates the Report in this way so that the column displays data for the calendar year. However, if another month is selected in the Settings, the columns will take into account that the fiscal year starts with the selected month.

Combine Display qty with Safety stock as

  • Allows you to switch between the ways Streamline refines Safety stock at the end of calculations.

ABC analysis Tab

The ABC analysis tab is used to configure the ABC analysis that is automatically performed for your project. Streamline allows carrying out two-dimensional ABC analysis.

  • Criterion 1 and Criterion 2 set the variables for the first and second axes in the analysis. Streamline allows you to choose among the following options:
  • None – disables the current axis.
  • Units – assigns the units sold data to the axis.
  • Revenue – assigns the revenue gained data to the axis.
  • Gross profit – assigns the calculated gross profit to the axis.
  • Cost of goods – assigns the calculated cost of goods to the axis.
  • Inventory value – assigns the imported inventory value to the axis.
  • Number of classes control sets the number of classes for each active variable.

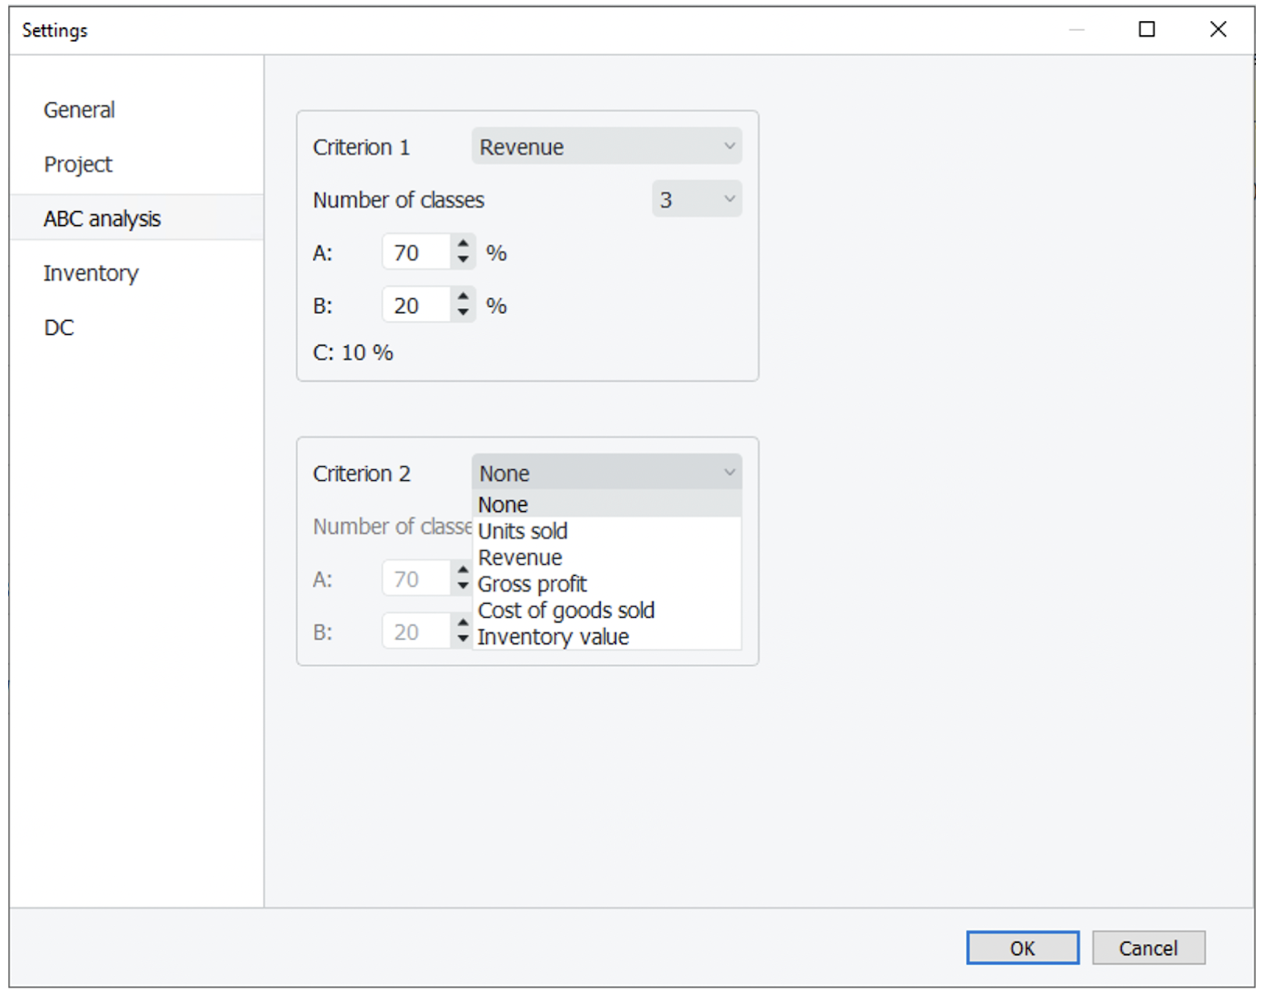
You can set the annual revenue percentage for each class Using the options below the Number of classes. For example, the percentage for A class set to 70% means that the class contains the items that give 70% of annual revenue in total. The percentage for the last class is a leftover from other classes and is calculated automatically.

Inventory Tab

The Inventory tab The Inventory tab allows you to customize your inventory reports on the Inventory planning tab.

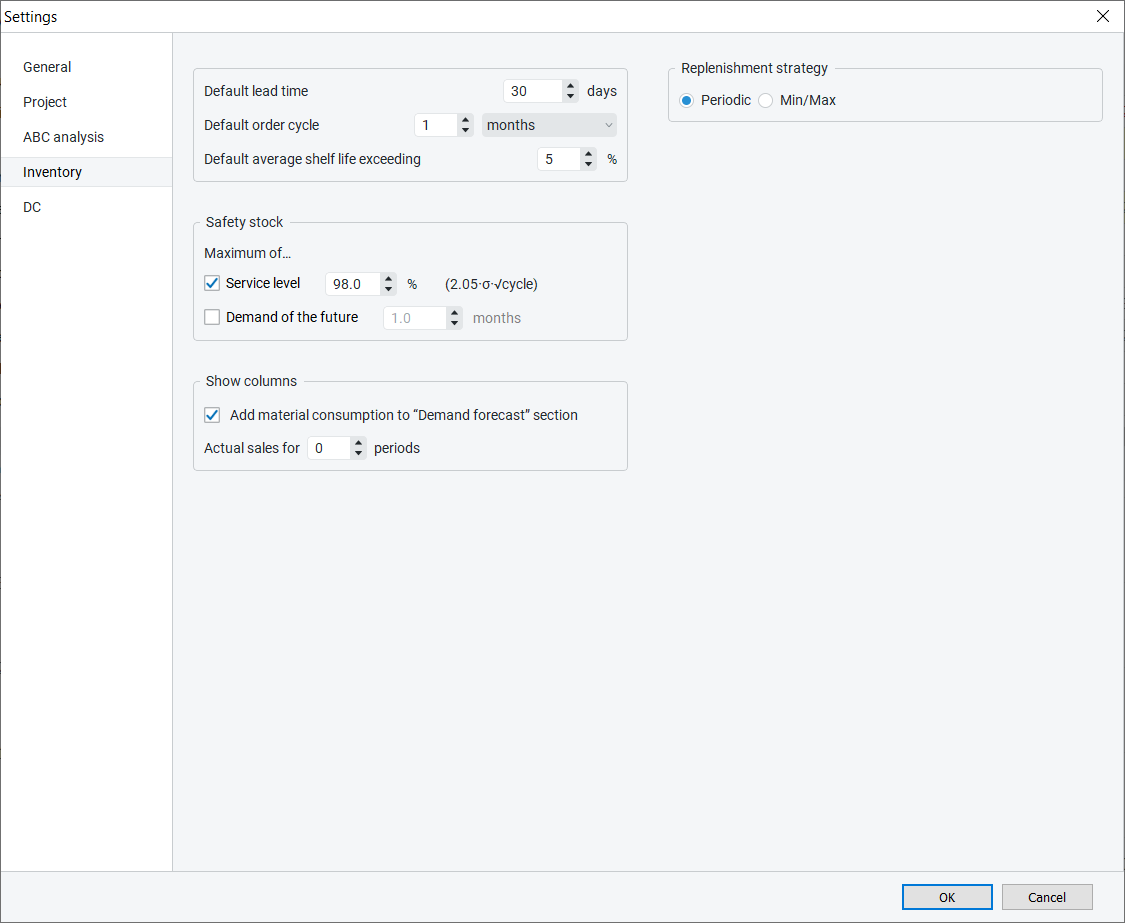
Default lead time option sets the default lead time in days for all the planning items.

  • Default order cycle option sets the default order cycle. It can be given in months/weeks (depending on the sales history aggregation period) or in days or lead times.

Default average shelf life exceeding sets the default percentage of the replenished quantity that might have to be discarded because of Shelf-life limitation.

All defaults are applied to all planning items together.

Safety stock section defines how the Safety stock is calculated. It can be:

  • Computed based on the given Service level percentage using the formula:

Safety_stock = α* δ *√t,

where:

  • α is determined by the given Service level unambiguously;
  • δ is the standard deviation of the model error;
  • t is the Order cycle value if the periodic strategy is used, or the Lead time value if the min/max approach is applied. The Order cycle and Lead time values are converted to the data aggregation periods before the calculation.
  • Taken as the demand of n data aggregation periods coming after the Lead time plus Order cycle. Where n is given.
  • The maximum from the two options above.

When checked, the option Demand of the future in the Safety stock section, defines the period for which the Safety stock has to be accumulated.

Show columns section contains options that hide or show the particular column or section in the Inventory report table. When the Add material consumption to the “Demand forecast” section option is unchecked, the Demand forecast section of the inventory report shows only the final demand forecast based on the sales of items. Otherwise, the section shows the summed demand that includes manufacturing consumption and sales of the items.

Show Actual sales for option adds table section in the Reports that display sales history for the specified period. Streamline can drive the replenishment process using Periodic or Min/Max replenishment strategies.

Streamline can drive the replenishment process using Periodic or Min/Max replenishment strategies.

The periodic strategy is used when purchase orders are placed periodically, for example, once per month. In this case, Streamline provides a just-in-time ordering plan of what, when, and how much to order. The information is given in the Current order section of the Inventory planning tab. The application uses this strategy by default.

The min/max strategy is used when a purchase order should be placed when a stock level is about a certain replenishment threshold (reorder point), and you need to fill it up to some maximum level. In this case, Streamline provides the Reorder point and Max inventory information via Inventory planning. This information can be used then to draw your purchase plan.

Distribution Center Tab

The Distribution center tab allows users to customize Streamline's distribution center settings.

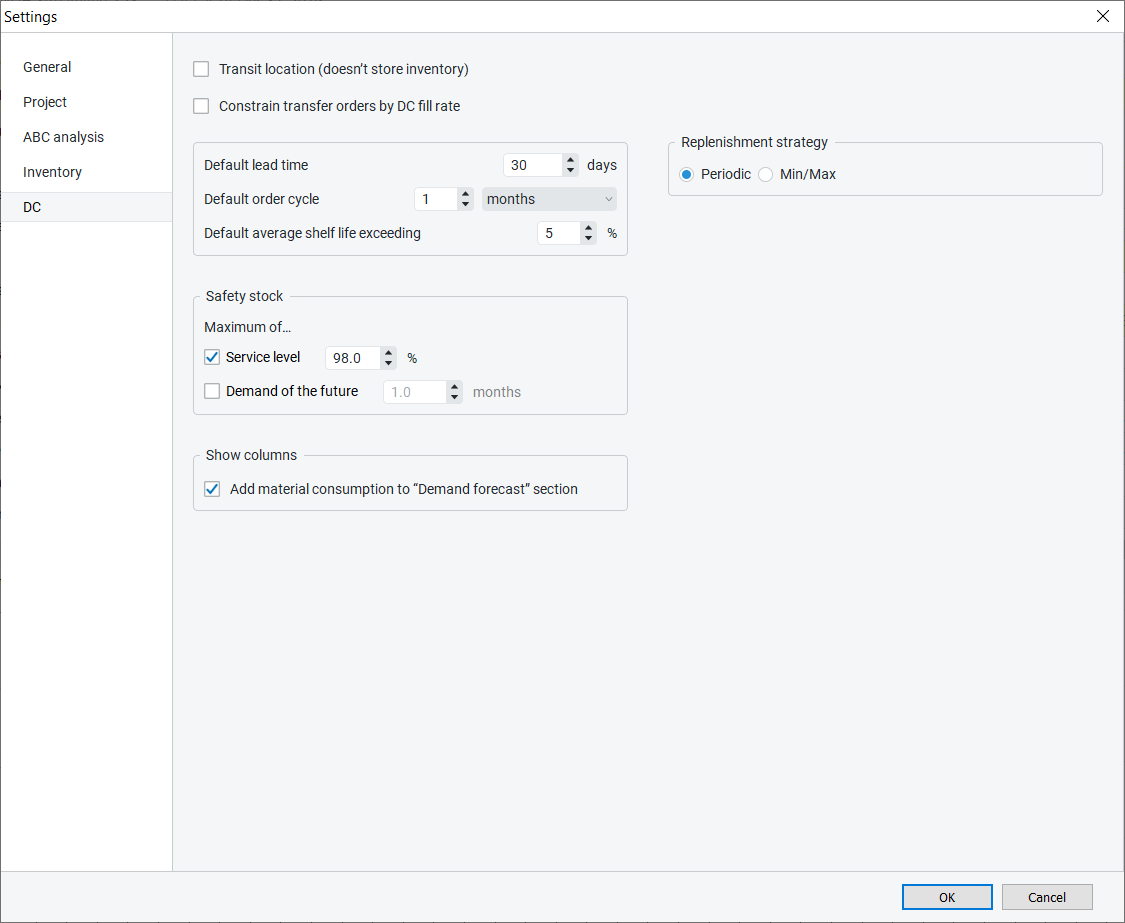
If the option of Transit location is enabled, it disables stock in DC, which automatically sets the On hand, DC Safety Stock values, and Stock days to zero.

If you set the Constrain transfer orders by DC fill rate check box checked, the order quantity becomes restricted according to the item availability in DC. The DC Fill rate % column can be displayed as a column on the Inventory tab.

The Default lead time option sets the default lead time in days to deliver an item from supplier to DC.

The Default order cycle option sets the default interval of time between two successive replenishment orders made from DC to the supplier. It can be given in months/weeks (depending on the sales history aggregation period), or in days or lead times.

Default average shelf life exceeding sets the default percentage of the item’s purchase quantity that we might have to: send to a clearance sale, return to the supplier, and so on.

The defaults mentioned above are set for all the planning items at once.

Safety stock section defines how the DC safety stock is calculated. It can be:

  • Computed based on the given DC service level percentage using the formula:

DC_safety_stock = √(SS21(α,t) + SS22(α,t) + … + SS2m(α,t)), SSi(α,t) = α * δi *√t, i = 1, …, m,

where:

  1. SSi is the safety stock for i-th location; m is the number of locations.
  2. δi is the standard deviation of the model in i-th location.
  3. α is determined by the given DC service level unambiguously.
  4. t is the Order cycle value if the periodic strategy is used, or the Lead time value if the min/max approach is applied. The Order cycle and Lead time values are converted to the data aggregation periods before the calculation.
  • Taken as the demand of n data aggregation periods coming after the Lead time plus Order cycle. Where n is given.
  • The maximum from the two options above.

When the Add material consumption to the Demand forecast section is unchecked, the Demand forecast section of the inventory report shows only the final demand forecast based on the sales of items. Otherwise, the section shows the summed demand that includes manufacturing consumption and sales of the items.

Streamline can drive the replenishment process using Periodic or Min/Max replenishment strategies. These options allow you to set up the replenishment strategy for the DC.


Next: Command line

Download PDF

program-settings.txt · Last modified: 2023/02/21 16:28 by admin