User Guide
1. Streamline Client
2.Streamline Server
3. Starting Up
4. Connecting data
5. Demand and Sales Forecasting
6. Inventory Planning
7. Reference
1. Streamline Client
2.Streamline Server
3. Starting Up
4. Connecting data
5. Demand and Sales Forecasting
6. Inventory Planning
7. Reference
 Add this page to your book
  Remove this page from your book
 Reports of this category display what is going to happen in the future based on historical data and your manual overrides. These reports include:
Below, we describe these reports in detail.
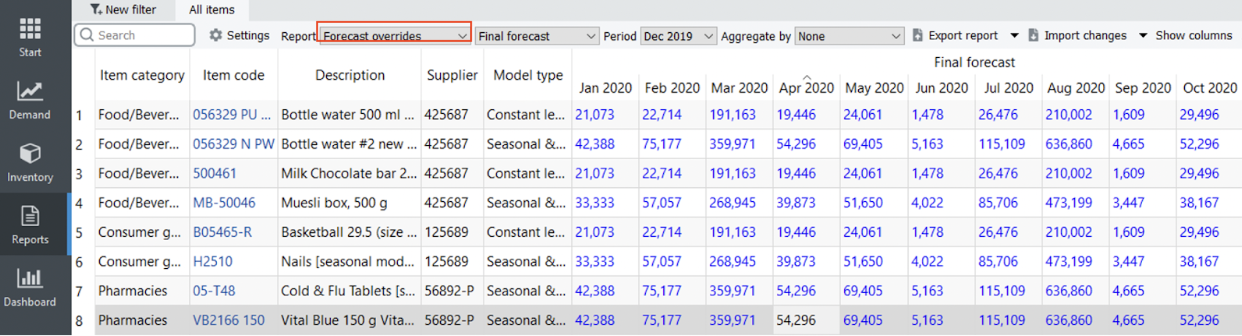
This report may be represented as a ‘Final forecast’, ‘Statistical forecast’, or Forecast version The Final forecast depicts the statistical forecast and any overrides for all the planning items, while in the Statistical forecast, overrides are not displayed.
The Statistical version report shows the statistical forecast of manual overrides if they are specified in the forecast version row in the Demand tab.
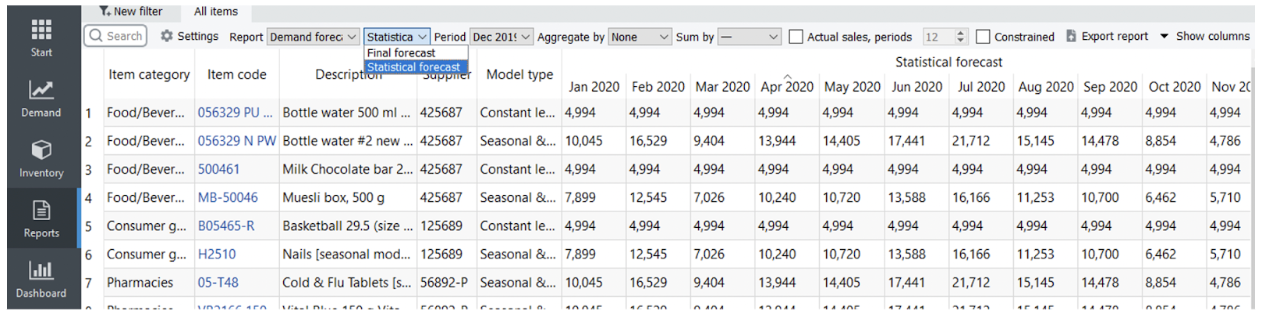
Period drop-down is used to select a past period from the project's archive and view the report content at that time. The default option is the current period.
Aggregate by drop-down allows you to group rows of the active report by one or several columns.
For example:
* Sum by drop-down allows you to aggregate the report data section by Year or Quarter. If an aggregated period is incomplete, Streamline shows its data in gray (see figure below). The actual sales option adds the Actual sales section to the report displaying actual historical sales. Streamline aggregates this section based on the Sum by option.
* Constrained option influences the display of the demand by taking into account the expected stockouts, which means that if, for instance, the stockout is expected, then the demand will be decreased by the stockout value.
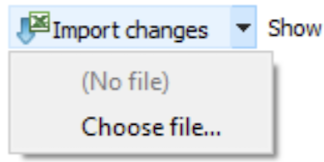
* Import changes button imports the Excel file created using the Export report button. These buttons are usually used together to make your overrides to the currently active report. You can import overrides even for aggregated reports.
If you click the little black arrow on the right-hand side of the button, Streamline shows you a two-line menu. The first option imports the file you have created using the Export Report button. Streamline shows the (No file) label if no file was created previously. The second option, ‘Choose file…’, allows you to import changes from any other file with a compatible format (see figure below).
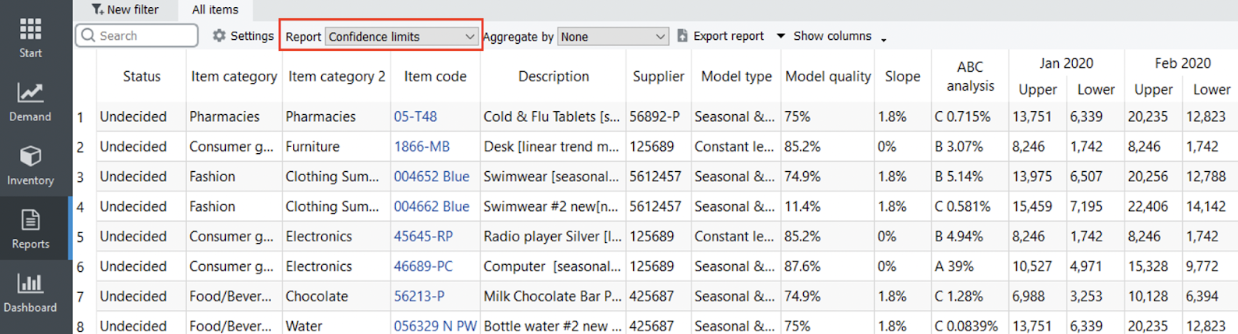
To provide more insights into risks and opportunities, Streamline can show probable forecast variability boundaries called the confidence limits, represented in the report by ‘Upper’ and ‘Lower’ for each projected period.
The report shows the measure of forecast performance based on the comparison between planned and actual sales.
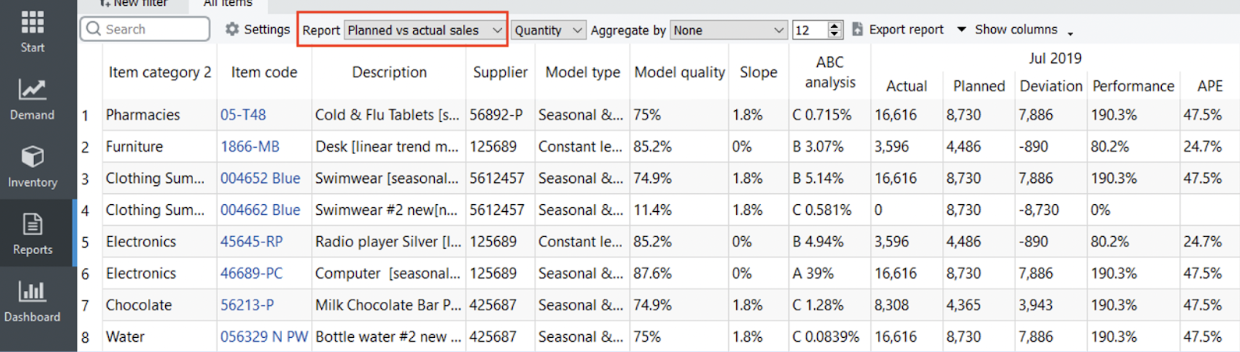
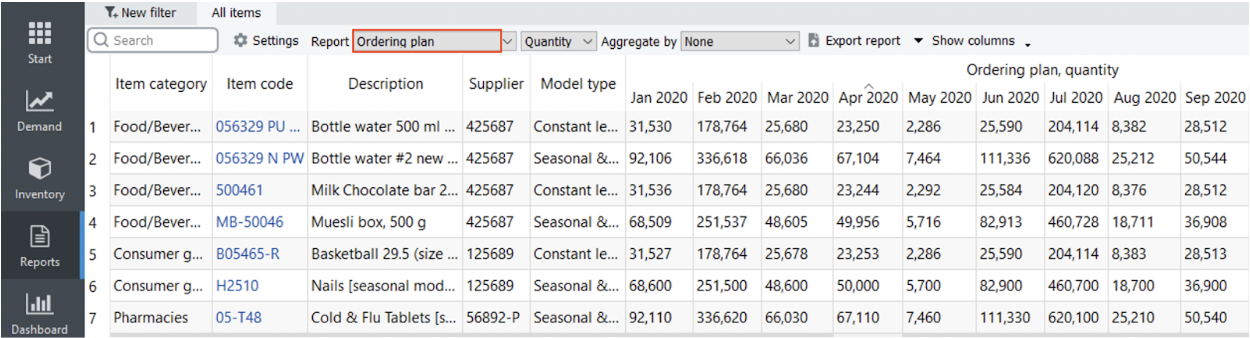
* The report may be represented in Quantity or Value. The ordering plan is default shown in quantities (the Quantity option). The Value option shows this report in the supplier's currency, accounting for the item purchase price.
* Aggregate by drop-down allows you to group rows of the active report by one or several columns.
* Export report button can be used to make your overrides to this report.
This report shows only your manual overrides to the statistical forecasts (see figure below). It is usually used to export only those to Excel.
This report shows the ordering plan for your inventory. The drop-down at the right of the Reports control sets the representation units for this report (see figure below). By default, the ordering plan is shown in quantities (the Quantity option). The Value option shows this report in the supplier's currency, accounting for the item purchase price.
This report indicates the revenues based on the current selling prices and their projected manual overrides (see figure below).
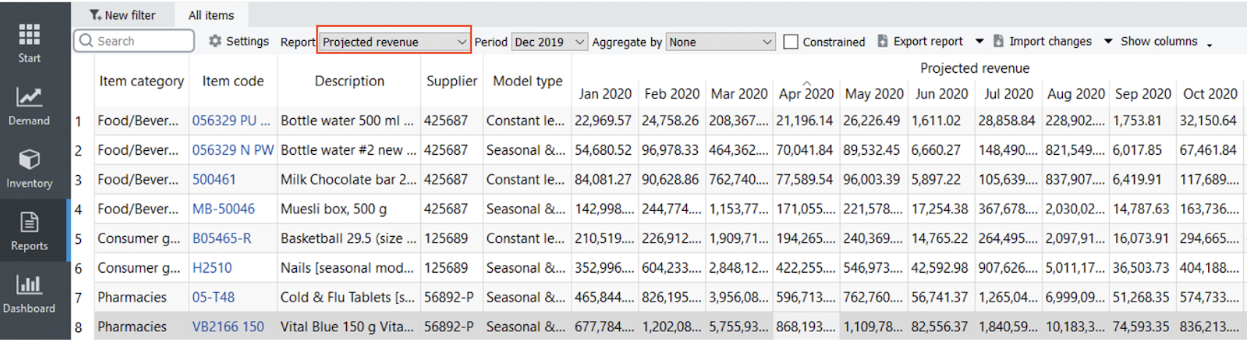
In the case of seasonal price forecasting, it shows the generated price forecasts.
By default, this report propagates current sales prices into the future. If you have manual overrides to those, they are also included in this report. They are indicated with a blue color. If seasonal price forecasting is enabled, this report shows the generated sales price forecasts.
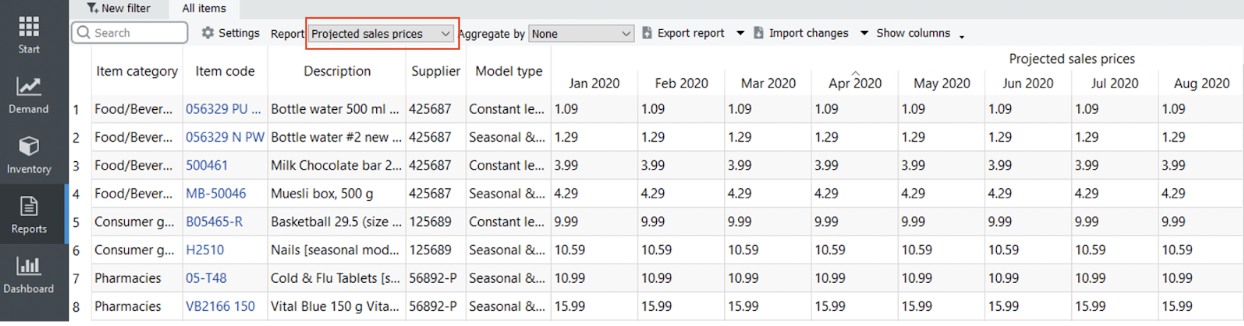
The Import changes button of the toolbar allows you to import the Excel file created using the Export report button. You can use these two buttons to make your own overrides to this report.
This report shows the projected inventory levels at the end of each period. The drop-down at the right of the Reports control sets the representation units for this report (see figure below). By default, levels are shown in quantities (the Quantity option is active). The Value option shows this report in the base currency, accounting for the item value.
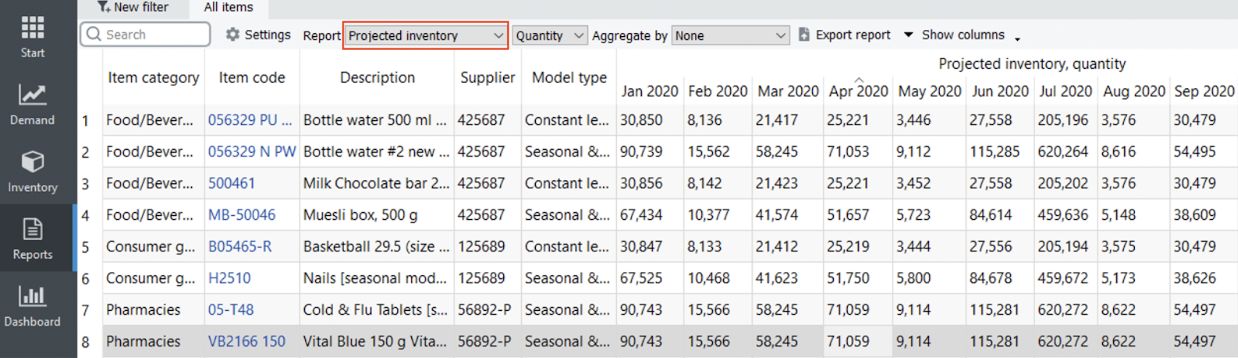
Empty cells in this report mean zero on-hand.
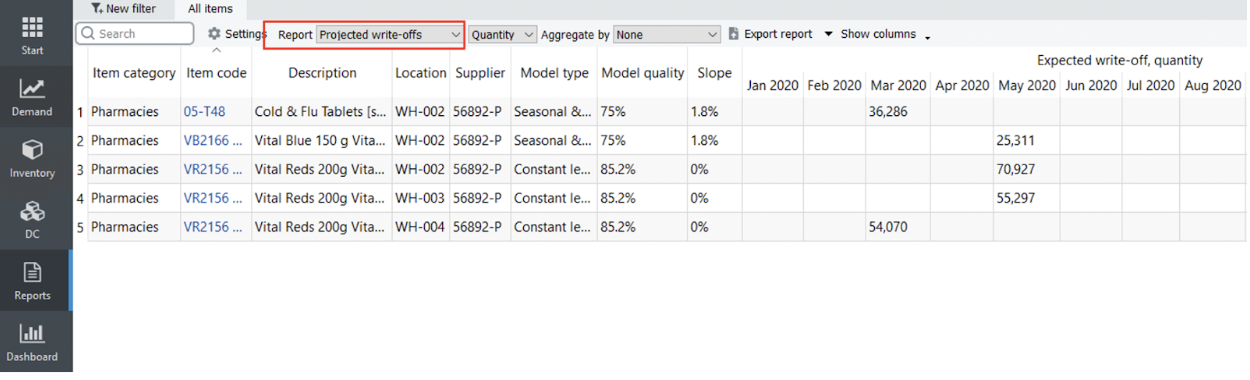
This report shows the expected write-off amounts for each period based on the imported information about batches. The drop-down at the right of the Reports control sets the representation units for this report (see figure below). There are two options:
This report shows how many units will not be sold because of the lack of inventory in stock for each period. These are expected quantities determined based on the forecasts, current on-hand quantity, future deliveries and shipments, and expected write-offs (see figure below).
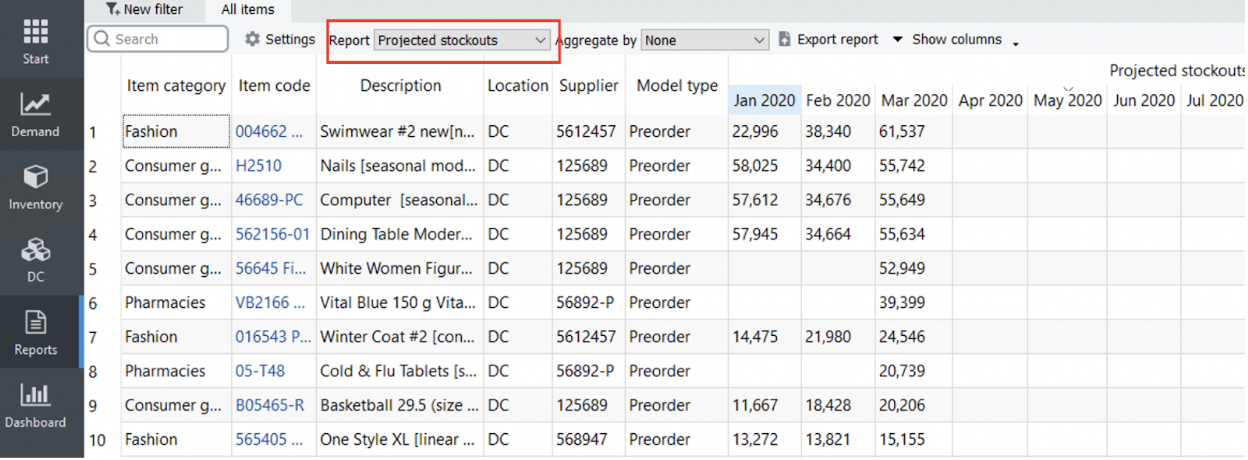
Streamline shows a sum of these quantities for each item in the Stockout column of the Inventory planning tab.
 Manage book (
 Help
Help