User Guide
1. Streamline Client
2.Streamline Server
3. Starting Up
4. Connecting data
5. Demand and Sales Forecasting
6. Inventory Planning
7. Reference
1. Streamline Client
2.Streamline Server
3. Starting Up
4. Connecting data
5. Demand and Sales Forecasting
6. Inventory Planning
7. Reference
 Add this page to your book
  Remove this page from your book
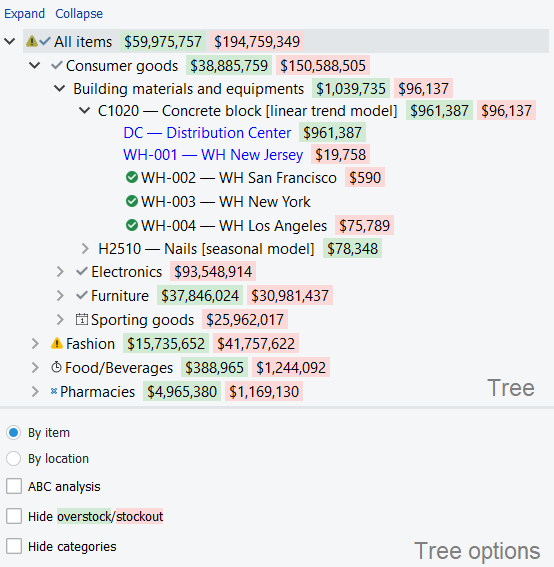
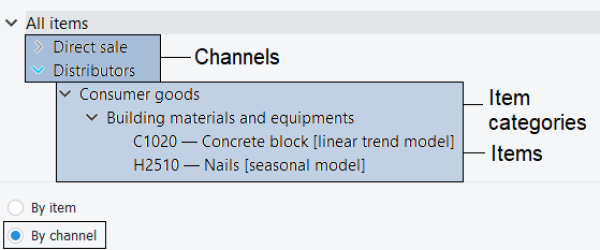
 The Tree view consists of a tree, allowing you go to through imported data hierarchy, and options that are designed to rebuild the tree according to the chosen viewing option (see figure below).
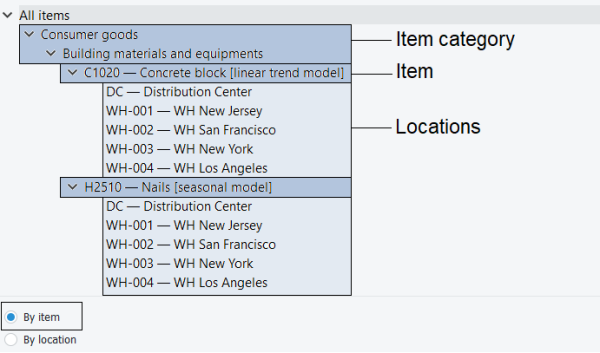
Depending on the imported and configured data, the Tree View shows imported items, locations, channels, and item/location categories. It is used to:
Information on the selected node immediately appears in the Table, Plot and the Panel.
The Collapse and Expand links, residing above the tree, are used to fold and unfold currently selected node.
Color-coded numbers in the Tree view show projected stockouts or overstocks in monetary terms. In other words, this feature indicates how much money the company is losing.
Green values show the amount of money that is held in frozen capital due to overstock. It’s calculated by multiplying purchase price and overstock qty.
Red values show the amount of money the company is losing on zero sales due to a lack of inventory. It’s calculated by multiplying sales price and stockout qty.
The goal is to reduce these numbers as much as possible by optimizing inventory levels.
Depending on the available data, the set of tree options differs.
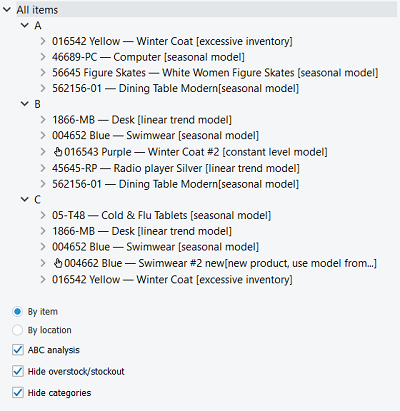
Here is a list of the available options if locations/channels were imported:
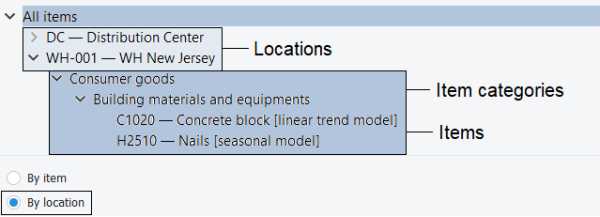
Here is a list of the available options if locations and channels were imported:
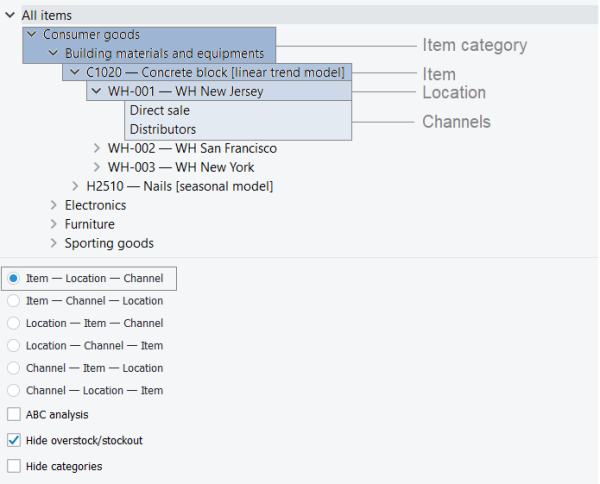
Additional options:
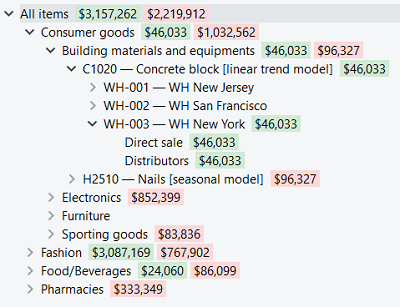
The Tree view is tightly linked to the Forecasting tab settings. Each option of the tab (except default option) has its own icon that is immediately prefixed to the currently selected tree node. The description of this notation is the following:
 The forecast is approved.
 The forecast needs attention and to be reviewed in a future.
 A note is added to the node.
 Zeros in the sales history represent the lost sales.
 A model multiplier is used.
 A custom sales history length is used to generate forecasts.
 A holidays calendar is used to capture the holidays in the item’s sales history.
 The manufacture procurement changed to purchase.
Each of the icons has its gray variant meaning that the node inherits the option from its parent.
The context menu of the Tree view holds the most common operations used to manipulate tree nodes. It is accessible with the right mouse button. The commands in the menu are applied to the currently selected node in the Tree view.

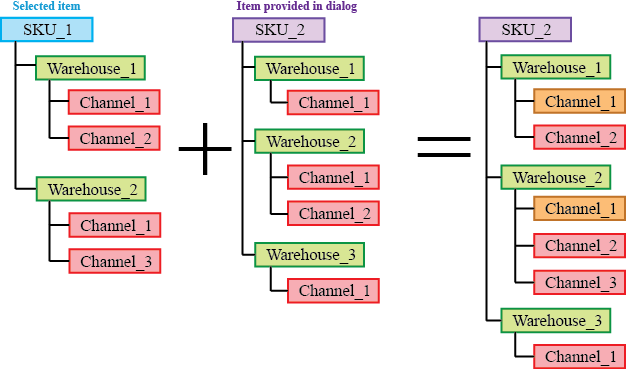
Orange in the figure above indicates the channels with merged histories.
![]()
 Manage book (
 Help
Help  A manually