User Guide
1. Streamline Client
2.Streamline Server
3. Starting Up
4. Connecting data
5. Demand and Sales Forecasting
6. Inventory Planning
7. Reference
1. Streamline Client
2.Streamline Server
3. Starting Up
4. Connecting data
5. Demand and Sales Forecasting
6. Inventory Planning
7. Reference
 Add this page to your book
  Remove this page from your book
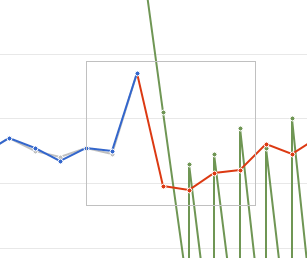
 The Plot of the Item view depicts demand history, statistical forecast, model fit, safety stock band, promoted periods (if available), and the projected inventory levels (if available).

If you import items' prices, the plot has two buttons on the top:
The plot supports basic manipulations as:
You can zoom a certain part of the plot in by selecting a rectangular area starting from the upper left corner and ending with the bottom right corner.
To zoom it out, right-click on the plot and choose the Zoom out command in the menu.
By dragging the plot in a zoomed state with the right mouse button, you can pan the plot and discover the area beyond the zoomed limits.
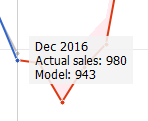
If only sales history was imported, the plot shows the actual sales, models fit, forecast, and the safety stock band. When you hover over a point in the Plot, Streamline shows current time-stamp and numerical values of all the lines which have data at this time point.
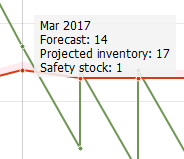
If you import inventory information besides the sales history, the Plot depicts projected inventory levels by a green line. Now the pop-up additionally displays the projected inventory at the end of the period, in the example – at the end of the March 2017.

If Confidence intervals were enabled in Settings, the Plot will also include the values for Upper and Lower Confidence limits for future periods.
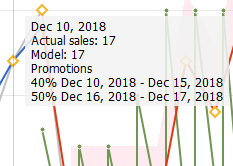
If you import information on promotions, the Plot indicates the affected periods with orange diamonds. The pop-up hint over such a period additionally shows a list of promotions the period includes.
 }}
}}
If you have some purchase orders that are in transition at this moment, they should be imported properly in order to allow Streamline to calculate the inventory levels and replenishments accurately. The plot depicts in-transition arrivals on the date they should be delivered in the stock. They can be also viewed in the In transition details dialog.
![]()
Besides the in-transition arrivals, Streamline shows the projected arrivals in the plot. They have generated automatically by performing multiple replenishment simulations within the forecast horizon. They are always delivered at the end of the period, for example, the 23 to 161 procurement happens on the very last day of the March 2017 (see the figure below).
![]()
 Manage book (
 Help
Help