User Guide
1. Streamline Client
2.Streamline Server
3. Starting Up
4. Connecting data
5. Demand and Sales Forecasting
6. Inventory Planning
7. Reference
1. Streamline Client
2.Streamline Server
3. Starting Up
4. Connecting data
5. Demand and Sales Forecasting
6. Inventory Planning
7. Reference
 Add this page to your book
  Remove this page from your book
 The multiple reports that Streamline offers are designed to provide a comprehensive view of the various facets of your inventory planning and demand forecasting. They can also be created with the help of custom filters. The reports display information from both historical and future perspectives.
A unique feature of Streamline is interactive inventory reports. It means that a report is recalculated on-the-fly as you change its input parameters.
Streamline generates reports on:
The Reports tab allows the generation of a broad spectrum of reports, including projected, historical, and current state reports on demand and inventory planning activities. Each of the tabs allows for creating custom reports. The Inventory Planning and Inter-store optimization tabs generate custom reports using filters. The Reports tab, besides filters, provides additional tools for customization like:
Below, we show how to create custom reports with examples.
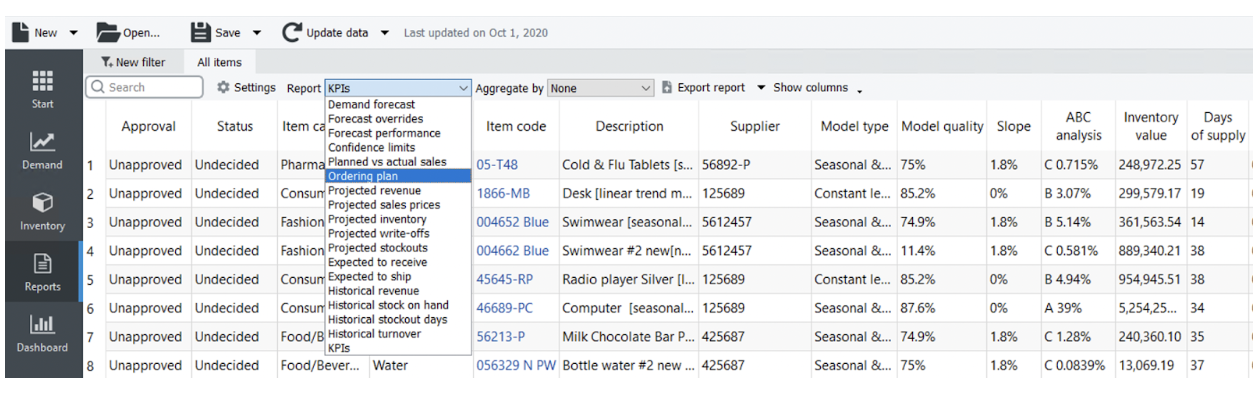
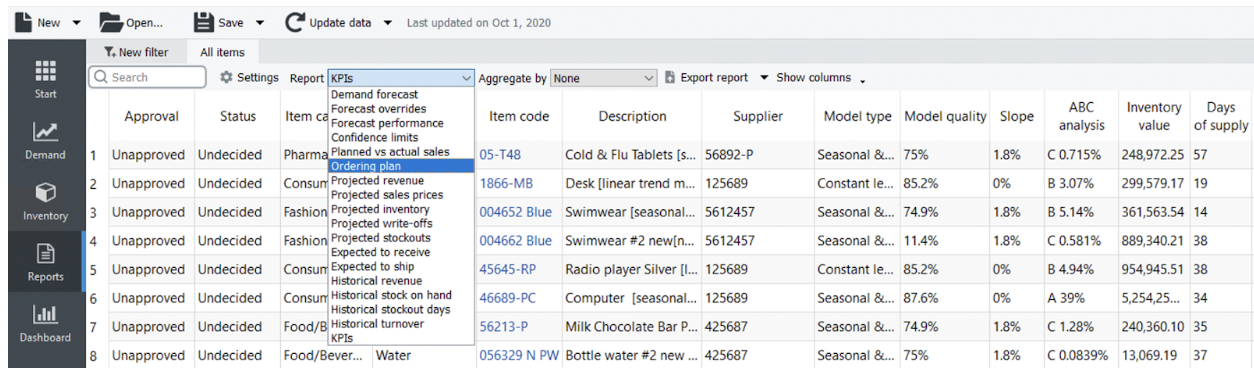
We use the Inventory Planning by Month built-in example to demonstrate the capabilities. To create a custom report in the Reports tab: 1. Select the required report type from the Report drop-down (see figure below). For our example, we choose the Ordering plan option.
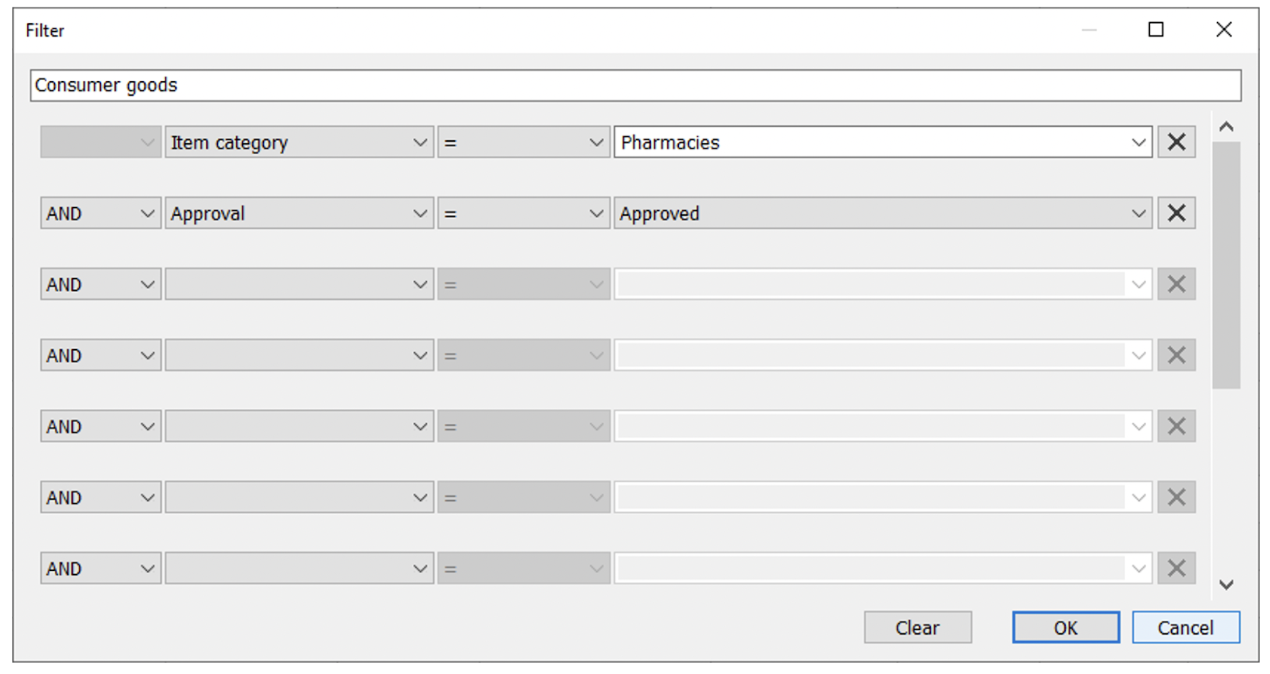
2. Optionally, you can filter the selected report by any columns of the header section. Filters allow you to show items satisfying given criteria. In our example, we would like to see items of the Consumer goods industry with forecast status Approved. To do this, we click the New filter button and configure the filter dialog as shown in the figure below.
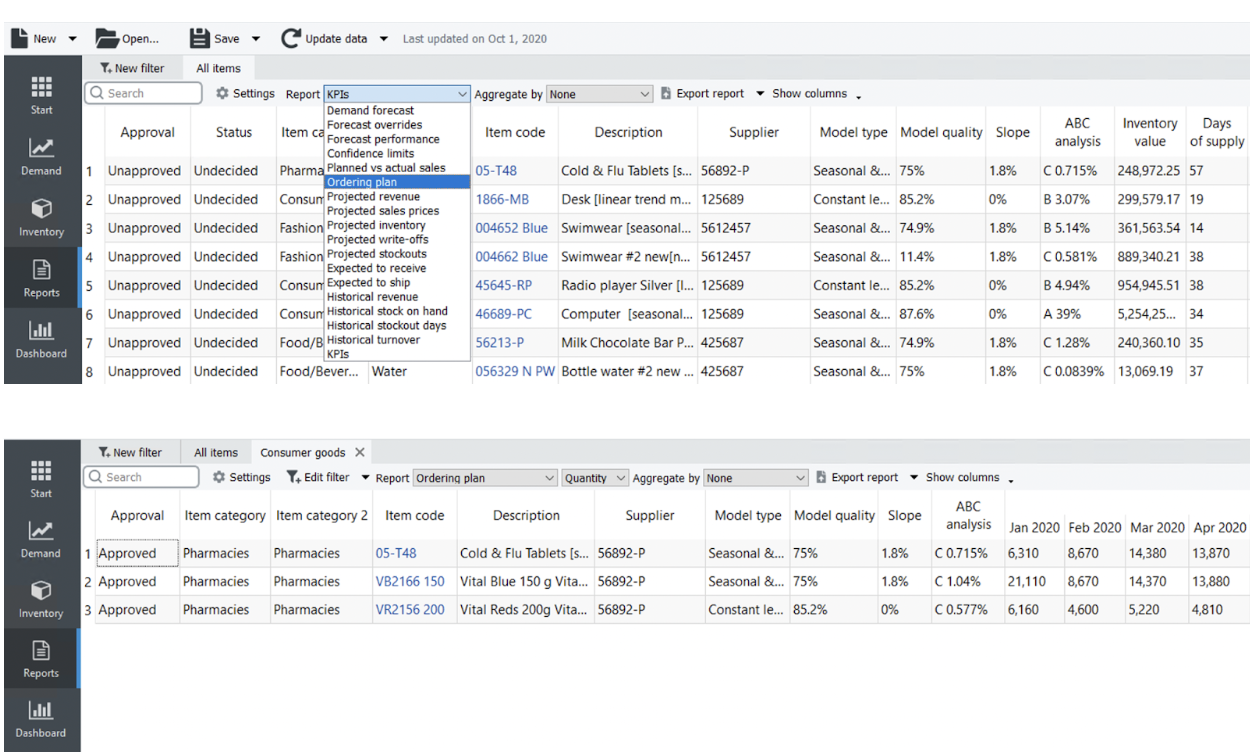
The result is shown in the figure below.
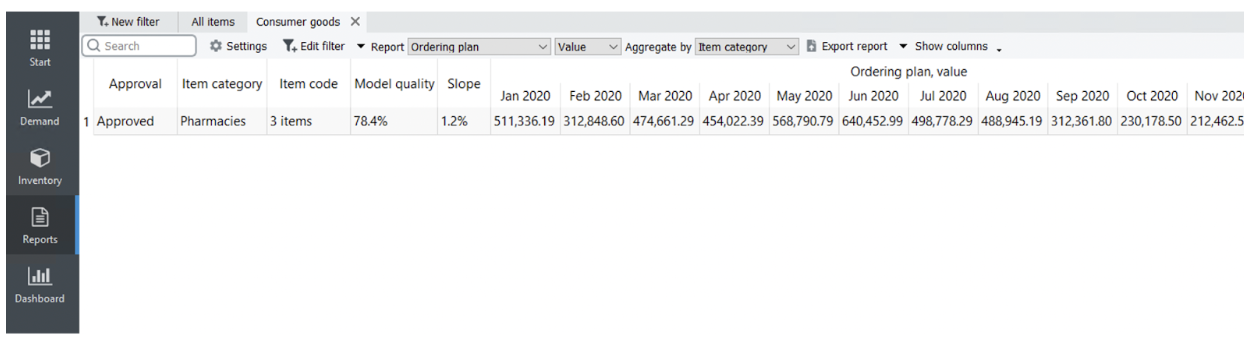
3. Let's aggregate the report by the Item Category column and change the representation unit to Value (see figure below).
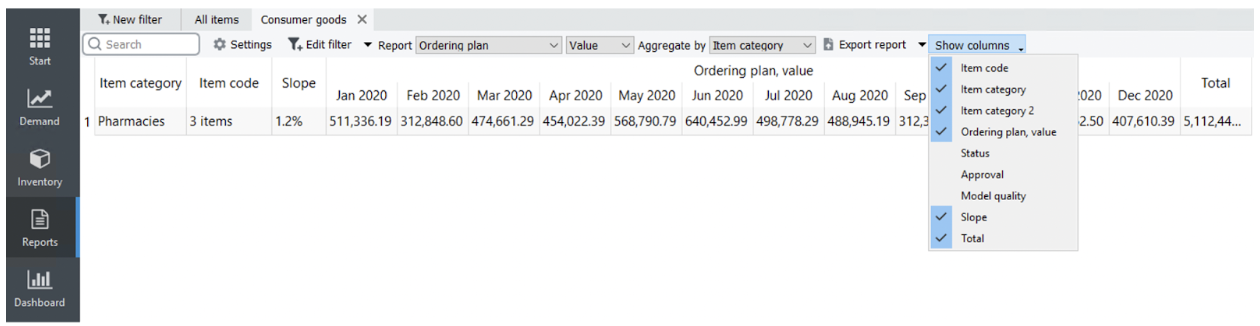
4. Optionally, you can hide/show particular columns in your reports using the Show columns button. Let's hide the Approval state and Model quality columns (see figures below).
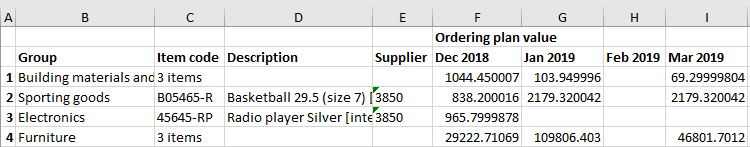
5. Finally, let's export the report to Excel by clicking the Export report button (see figure below).
As we mentioned, Streamline displays inventory reports on the Inventory planning, and Interstore optimization tabs. This section shows how to create a custom inventory report using the Material Requirements Planning example in the Inventory planning tab. Customized reports on the other tabs are made in the same way.
Let's create two reports:
To accomplish this, we will use filters.
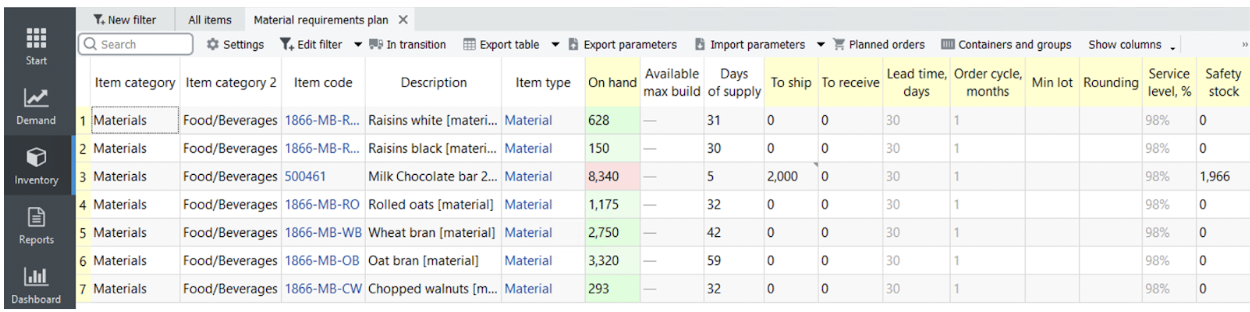
To create a report representing Material requirements plan, we click the New filter button. This opens the Filter dialog.
The result is shown in the figure below.
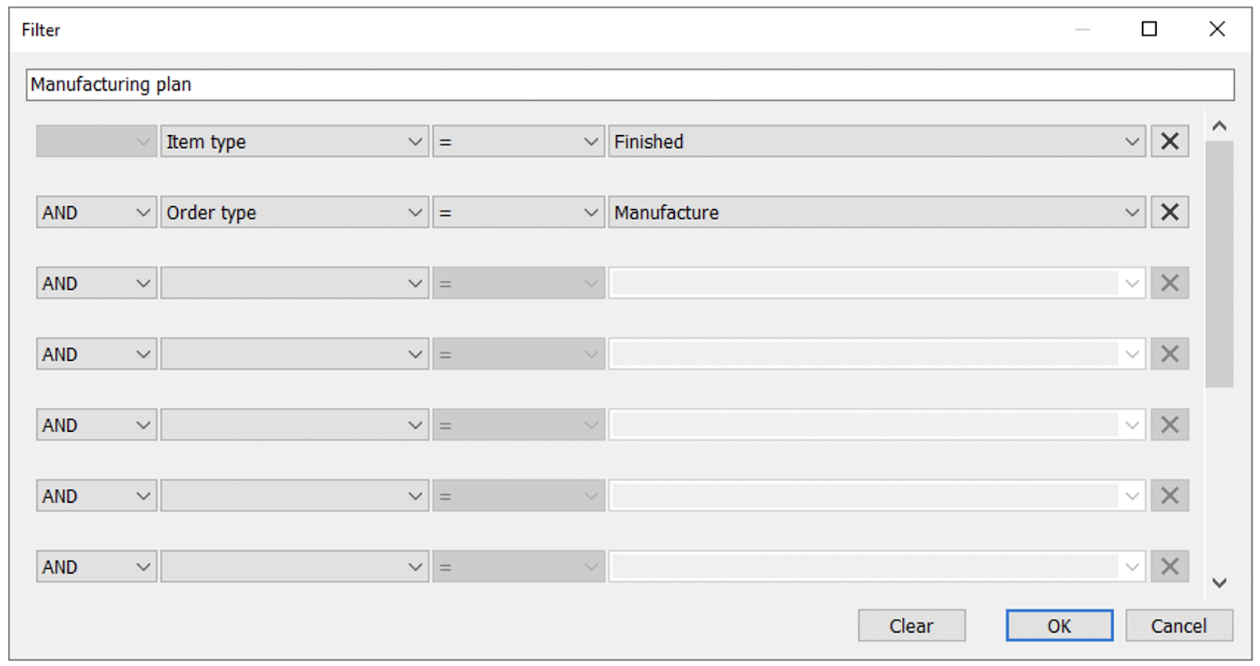
To create a report showing Manufacturing plan, we click the New filter button again and configure the Filter dialog as shown in the figure below.
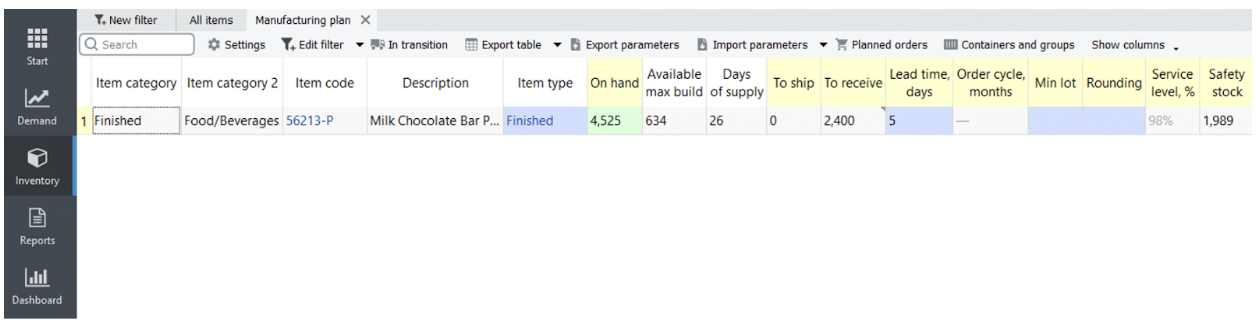
The result is shown in the figure below.
 Manage book (
 Help
Help