5.4. Exporting Forecasts to Excel
Streamline has several reports as well as several ways to export them.
One of them is the Demand forecast report. This report contains the statistical forecast, final forecast, and forecast versions, whereas the second one has all your manual forecast overrides.
The Demand forecast report is on the Reports tab. The final forecast is displayed by default (see figure below).

All of the forecast overrides are in blue.
You can aggregate the report by item, location or channel, ABC analysis, any item category, or all of the columns at once using the Aggregate by control before exporting it from Streamline (see figure below).

Using the Sum by control, you can also sum the forecasts by quarter or year (see figure below).

Users can export to Excel any report from the Select report list.
Let’s export our Final forecast report to Excel by clicking the Export report button in the Reports toolbar.
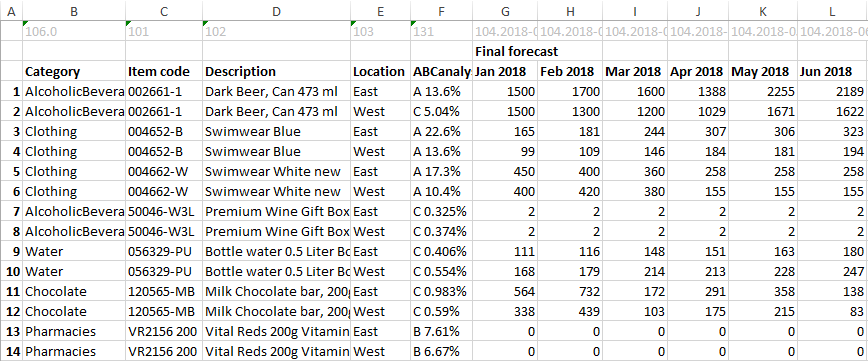
Streamline automatically creates an Excel file with the report table, saves it on the hard drive, and opens it in Excel (see figure below).
