Sidebar
Table of Contents
Inventory planning
An important challenge of a sales company is to estimate the understocking and the overstocking risks and get to know how to plan future supply chain. The estimation requires minimization the potential inventory volume, necessary to cover future customer demand. A lot of factors must be taken into consideration here, including product lead time, cost of delivery, minimal lot size and so on. GMDH Shell BF offers a solution for these issues basis on the built forecasts.
In this section well show how to get advices on future inventory replenishment from GMDH Shell BF. The program provides several ways to connect the input data. Now we consider connecting an Excel data file.
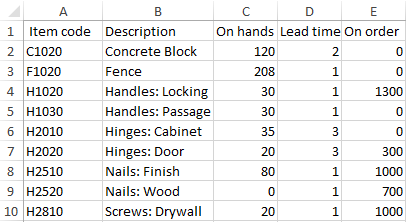
We will use two Excel files: the SKUs.xlsx and the !inventory.xls data files. The first file contains sales of various SKUs on the monthly basis. The second information such as: product ID, product description, available stock, product lead time, ordered products and minimal order size.
1. Connecting the data
Lets start by creating a new project by clicking New and selecting CSV/XSL/XSLX connection in the program toolbar. Select the file SKUs.xlsx and click Open.
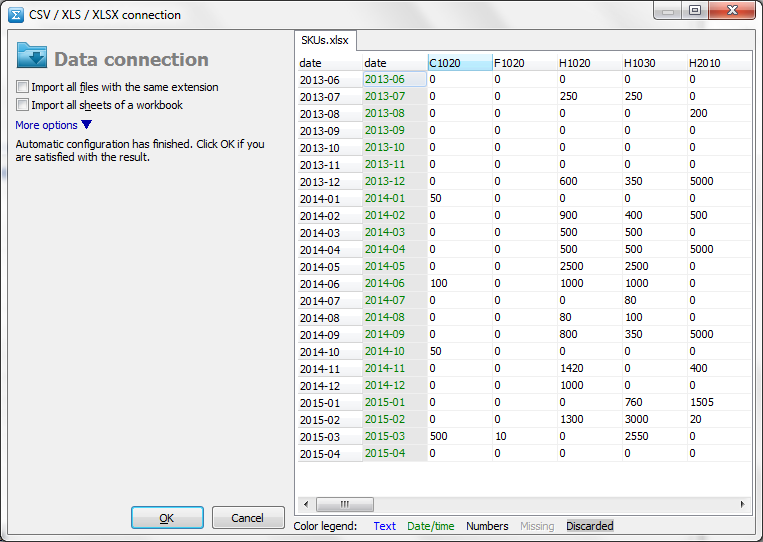
The connection dialog is shown below. GMDH Shell BF automatically adjusted all necessary options to read the data correctly. To know more about the connecting a data and the file format you can address to the reference or Demand Forecasting tutorial. Click OK to continue the process.
2. Selecting the forecasting template
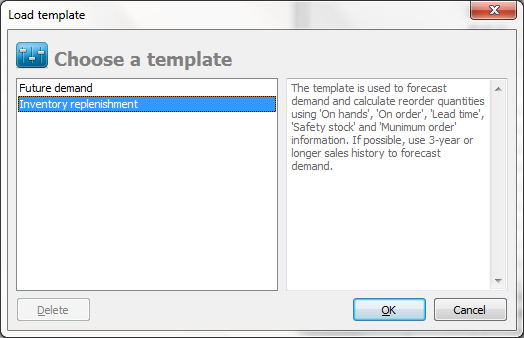
GMDH Shell BF offers two templates that designed to:
- forecast future demand;
- calculate inventory replenishment based on the forecasts done.
The second task actually includes the first one. Therefore, to have reliable inventory replenishment results GMDH Shell BF requires as much historical data as you can provide. We recommend having at least 3-year history period. As you see from the figure above, the data have a 23 month history. Its not enough to get reliable results for one year forecast, but is sufficient to build half-year forecast.
3. Selecting the variables to forecast
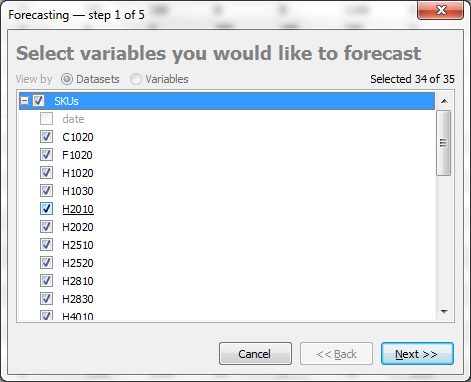
Once the template has been selected, the Wizard is started. Its a system that helps a user to set all necessary options via five simple steps. The first is to select the variables (SKUs) you would like to forecast and build replenishment plans. Lets select them all and click Next.
4. Setting the forecast horizon
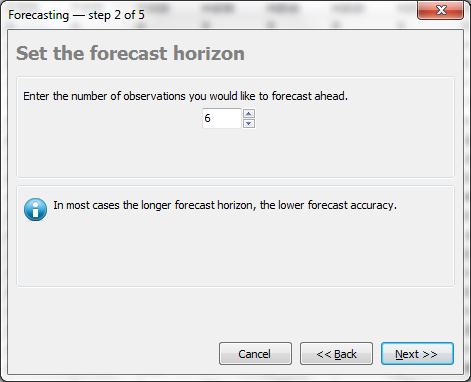
Forecast horizon is the number of time points in the future, you would like to know the SKU sales data. Built forecasts used to create suggestions on the future replenishment plan for the SKUs, you have selected previously.
Commonly the stock replenishment plan is built for the future lead time of the SKU. Therefore, we recommend the forecast horizon to be at least double maximum lead time among the SKUs. There is also a limitation for the upper value of the forecast steps. To get a reliable forecasting results it is recommended to have the forecast horizon no longer than 25% of the history length.
In this example, the maximum lead time is 3 months, consequently lets set the forecast horizon to 6 months. Set 6 in the option and click Next.
5. Setting the post-process operations
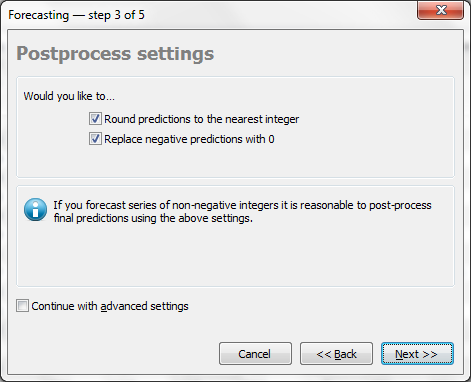
Its a common practice to round the forecasts to the nearest integer and replace negative predictions with zero, if the product is counted in integers and the returns are not in the focus. GMDH Shell BF offers to perform such manipulations. It is reasonable to leave the options checked in this Example and click Next to start building the models.
Continue with advances settings option allows you to specify input variables that will be used for forecasting and adjust the computational volume of processing.
6. Evaluating the forecasts
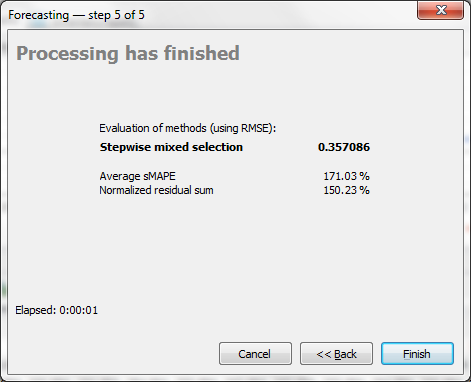
After the process has finished, you will see an evaluation report of the forecasting method on the holdout set. The evaluation is based on the holdout approach and presented by the RMSE, sMAPEand NRS errors.
Click Finish.
7. Generating the forecasts
As you click Finish, the forecasting method is applied to the data to generate a forecast and calculate the inventory replenishment plan.
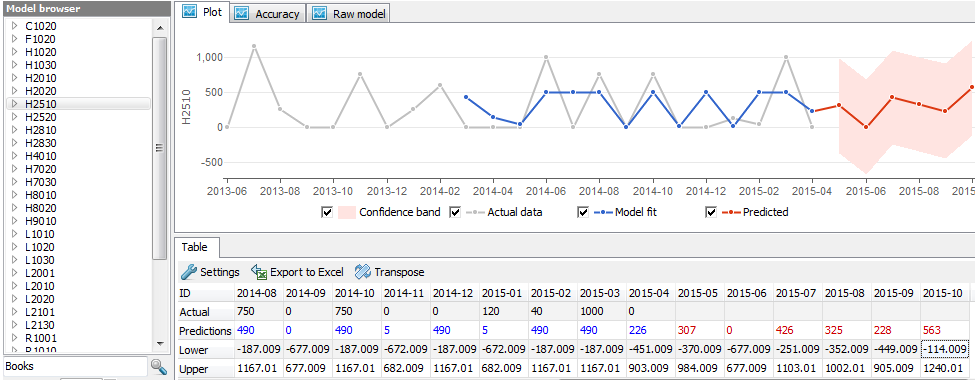
The Processing results tab is now active. It contains the Model browser, helping you to select any of forecasted item, the Plot, depicting the forecasting results graphically, and the Table, displaying the same information numerically.
8. Viewing the inventory report
Plan for the stock replenishment is on the Inventory report tab. The report aggregates demand forecast, inventory replenishment information and warns about potential stockouts and overstocks.
The report aggregates demand forecast calculated by GMDH Shell, inventory replenishment information and warns about potential stockouts and overstocks.
There are four sections in the table: Inventory, Replenishment calculation, Forecast by periods and Identified issues.
Inventory section shows available information about the stock: Description of the items and the Item code.
Replenishment calculation shows information for planning the replenishment of the stock:
- On heands - the available product stock; is read from the !inventory.xls file.
- Lead time - the time (in months) between the placement of an order and delivery. Is read from the file !inventory.xls if it exists, otherwise the default value of 1 is applied to all the items. The default value can be changed in the report settings via the Settings button found above the table. You can also edit the value directly in the table. All the values edited by a user appear in a blue color in the table.
- On order - the number of already ordered units of the item. Is read from the !inventory.xls file.
- Min order - the minimal item quantity that is required in the order. Is read from the !inventory.xls but can be edited manually by a user.
- Safety stock is an assessment of the reserve stock for the next lead time period in which there are no stockouts according to the forecast. The assessment can be calculated using one of the three methods chosen in the report settings. To specify the method click the Settings button.
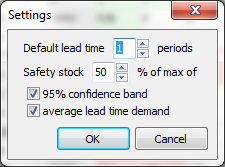 The safety stock can be calculated as given percentage taken from the:
- confidence limit;
- averaged sales volume over the past lead time period;
- maximum of the methods mentioned above.
You can also set the value manually.
- To order is the quantity that should be ordered according to Forecast by periods, Lead time, inventory On hands, On order, Safety stock, Min order and calculated as follows:
To_order = {min(0; Fn + Safety_stock - min(0; On_hands + On_order - Fc)) }Min_order,
where the:
FnandFcare the summed forecast over the next and the current lead time period correspondently;min(a; b)returns the minimum among theaandb;{v}Min_orderrounds thevto the nearest upper value that is multiple of Min order.
Cells in the Forecast by periods section are colored with green and red colors. The green cells show how many periods you are able to sale using the resources of the On order and On hands cells. Periods with shortages are red.
The Stockout column in the Identified issues section says about the amount of shortage in the current lead time period. It is calculated for the items having red cells as:
Stockout = |On_hands + On_order - Fc|.
The Overstock column indicates the products that are overstocked in the next lead time period. The values are calculated for the items having only green cells as:
Overstock = On_hands + On_order - Fc - Fn - Safety_stock.
9. Exporting results
GMDH Shell BF allows you to export the entire inventory report or an order list into a newly created Excel file.
To export the inventory report, click the Export table button found above the report table. The table will be copied into a new Excel file and saved of the inventory_table.xls name. If this file already exists in the input data directory, it is replaced.
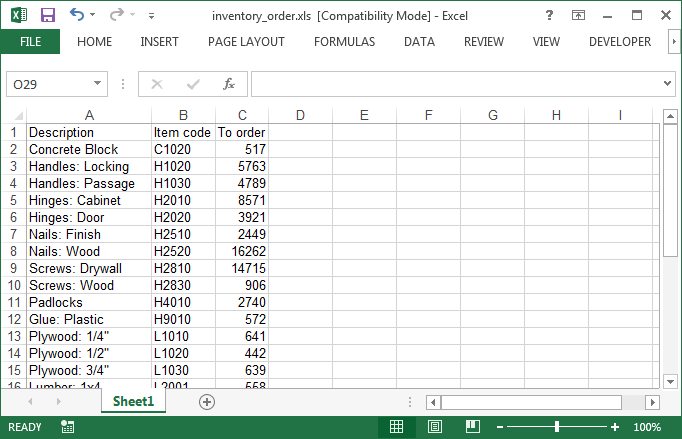
The program can also extract from the report an order list comprising the items which have nonzero values in the To order column. To do this, click the Export order button above the report table. A table representing the list is created in a new Excel file and saved of the inventory_order.xls name.

