Sidebar
 Add this page to your book
  Remove this page from your book
  Manage book (
 Help
Help 5.10. Key Performance Indicators
5.10. 重要業績評価指標
Key Performance Indicators (KPIs) help to achieve company’s strategic and tactical goals. Companies use KPIs to track their position and to evaluate the implementation of the strategy.
重要業績評価指標(KPI) は、企業の戦略的な目標の達成の手助けとなります。 企業は、KPIを利用して自身の位置を追跡し、戦略の遂行を評価します。
Streamline allows to supervise the following KPIs:
GMDH Streamlineでは、次のKPIを管理しています。:
- Expected overstock value is the value of expected overstock in monetary terms.
- 期待過剰在庫金額は、予想される過剰在庫の在庫金額です。
- Expected stockout value is the value of expected stockout in monetary terms.
- 期待欠品在庫金額は、予想される欠品の在庫金額です。
- Non-moving inventory value shows (in monetary terms) the items that will not be sold in the future according to the forecast except the situation when the forecast is generated using an intermittent demand model.
- 滞留在庫金額は、間欠需要モデルの場合を除き、予測によると将来販売されない品目を(金銭的な用語で)表します。
- Inventory turnover shows how many times the item was purchased and then sold out for the last 12 months.
- 在庫回転率は、最近の過去12か月以内で、何回購入され、売り切ったのかを表示しています。
- Average days to sell displays how many days it takes to make one turnover cycle.
- 平均在庫回転日数は、在庫が1回転するために必要な日数を表示しています。
- Gross margin is the percentage gross profit margin, or how many cents company earns from each dollar of the revenue.
- 粗利益率は、パーセントであらわされる売上総利益率、もしくは1ドルあたりの売上金額にて取得できるセントです。
- Turn-earn index shows the item’s gross margin percentage accumulated over the last 12 months.
- 交差比率は、直前12か月で累積された売上総利益率パーセントを表示しています。
- Annual revenue is the income that the company has collected in the last 12 months, or simply annualized income if we have less than 12 months of history.
- 年次売上金額は、直前12か月にて企業が得た売上金額、12か月間の履歴がない場合、単純な年換算された売上金額となります。
- Revenue next year is the expected revenue for the next 12 months based on the forecast or planned demand and sales prices.
- 翌年次売上金額は、需要予測と予測販売単価から翌12か月間の期待できる収入です。
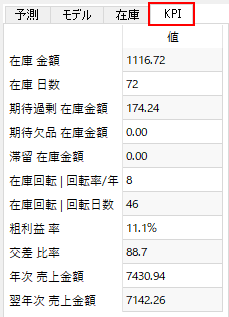
The Key Performance Indicators are displayed in Demand forecasting tab per item and in the Reports tab as a report. In the Demand forecasting tab, the Key Performance Indicators are located on the bottom right panel as a separate KPIs tab.
需要予測タブでは品目別のKPIが表示され、レポートタブでは1つのレポートにすべての品目のKPIが表示されます。重要業績評価指標は、需要予測タブの右下のパネルのKPIタブに位置しています。
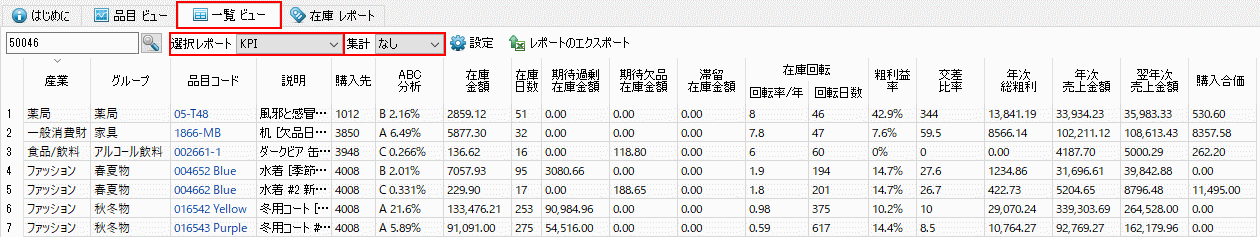
The KPIs report can be viewed in the Reports tab. The report can be aggregated by an item, item category, or location using the Aggregate by control.
レポートタブにてKPIレポートを確認できます。集計コントロールを利用し、このレポートを品目または品目分類または地点別に集計できます。
As the KPIs improve, the supply chain works more efficiently and the profitability grows to the capital being released and the lost sales being prevented.
KPIが改善すると、サプライチェーンはより効率的に機能し、資本が解放され、機会損失を抑えられ、採算性が向上します。