Sidebar
 Add this page to your book
  Remove this page from your book
  Manage book (
 Help
Help As of control is used to set the period at which you want to have forecasts and inventory plans. If you open the drop-down list, Streamline shows you the periods for which the forecasts can be generated. It also indicates the past periods where forecasts were obtained. It is done by a little blue circle before the period in the list. So, on the one hand, Streamline allows you to go back in the previous periods and see what were the forecasts and plans on that time. On the other hand, it allows you to forecast the past periods, where we have actual data, and, consequently, evaluate them.
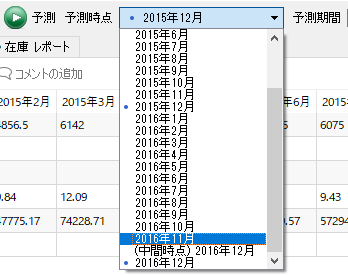
予測時点コントロールでは、需要予測と在庫計画の期間を選択します。ドロップダウンリストを開くと、予測作成可能期間が表示されます。過去に予測立案した期間には、先頭に小さな青い丸が表示されます。一方で、(現時点では実績データをもつ)過去の期間の予測結果の参照や再予測ができます。参照と再予測は、結果として予測の評価になります。
Besides the concrete period options, this parameter has the Incomplete period option (the incomplete December on the figure). The option means that the current period is not over, and makes Streamline ignore the sales data in this period and build the forecast as if the last period is the previous one. This option designed to make Streamline not to underestimate the forecast for the incomplete period. Thus, if your sales are not at the end of the current period, use this option when forecasting and building inventory plans.
このパラメータには、実際の期間に加えて、中間時点の期間オプションを表示しています(図中の(中間時点) 2016年12月です。)。このオプションは対象期間の未完了を表しています。このオプションが選択された場合、対象期間の販売データを利用せず、直前までの販売データを利用して予測と計画を立案します。オプションは、中間時点の期間予測の予測を過少評価させないために、設計されています。したがって、現在の期間の終了時点で販売データが一部が用意できていない場合、このオプションを利用して予測と在庫計画立案します。
Horizon sets the number of periods in future for which you want to have forecasts and inventory plans.
予測期間に、需要予測や在庫計画の期間数を設定します。
Tabs
タブ
The program Tabs are the following:
プログラムタブには、次があります。:

- Start provides access to the built-in examples and learning materials.
- Item View allows:
- viewing and modifying the imported data on an item basis;
- viewing the demand forecasts by item or location graphically and numerically;
- adjusting the forecasts;
- making corrections to the models on every level of the data hierarchy;
- performing the ABC analysis;
- viewing inventory information of every item.
- はじめには、組み込みのデモデータや教材にアクセスできます。
- 品目 ビューでは、次ができます。:
- 品目単位でインポート済みのデータを閲覧や修正
- 品目別や地点別に需要予測を数値やグラフで閲覧
- 予測の調整
- データ構造のすべてのレベルでのモデルの修正
- ABC分析の実行
- 品目別在庫情報の閲覧
- List View represents all the items as a list and allows generating a number of reports. Some of the reports can be modified in Excel and imported back to Streamline.
- 一覧 ビューは、すべての品目を一覧で表示し、多くのレポートを作成します。いくつかのレポートは、Excelにエクスポート後、Excelにて編集、ExcelからGMDH Streamlineにインポートできます。
- Inventory Report shows all inventory information on the items, generates replenishment recommendations and warns the user about current and expected stock-outs and overstocks.
- 在庫レポートは、品目の在庫情報を表示し、推奨される補充計画を立案し、現在と将来の欠品と過剰在庫を警告します。
- Distribution Center provides the ability to plan the inventory and manage safety stocks using a two-echelon system.
- 物流センターは、2段階システムを使い、在庫計画の立案や安全在庫の管理をします。