User Guide
1. Streamline Client
2.Streamline Server
3. Starting Up
4. Connecting data
5. Demand and Sales Forecasting
6. Inventory Planning
7. Reference
1. Streamline Client
2.Streamline Server
3. Starting Up
4. Connecting data
5. Demand and Sales Forecasting
6. Inventory Planning
7. Reference
 Add this page to your book
  Remove this page from your book
 Streamline is able to identify upcoming stockout and overstock situations and estimates expected lost sales or excess quantities. Shortages and overages are determined based on the generated forecasts, thus, Streamline calculates expected stockouts or overstocks that might happen to an item in the future.
In addition, Streamline computes expected distortion values based on the item balance value or purchase price.
In this article we:
Basically, there are three situations that might happen to an item in future: 1) a stockout expected, 2) an overstock expected, and 3) no overstock or stockout is expected.
Streamline recognizes items and drops them into these categories. To explain the rules making these categories, let’s introduce the following notation:
In addition, Streamline implements a special color-coding for the inventory report that helps you easily to discern items with insufficient inventory or excess quantity.
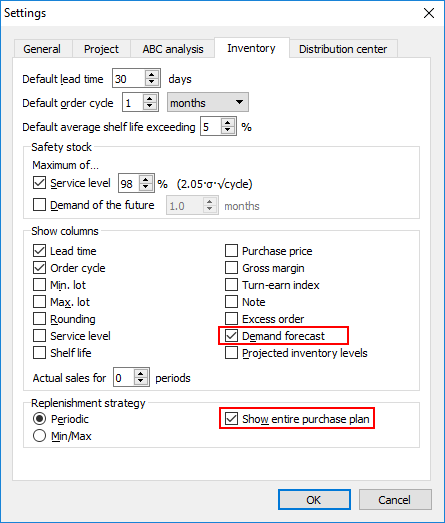
To explain the rules and color-coding, let’s show the Demand forecast and Purchase plan sections in the inventory report. To do this, go to the Settings of the Inventory planning tab and check the options shown in the figure below.
Further, we proceed with the example project.
To calculate a stockout, Streamline performs the event-based simulation modeling of stock movements during the lead time period. The lowest (negative) inventory level obtained during this simulation is the Stockout amount.
A crude version of the formula that does not account for the passage of time for stockout calculation would be the following:
Stockout = MAX(0, D(LT) - On hand - InTrn(LT) + PndSales(LT)).
Consequently, a crude rule for stockout determination is:
D(LT) > On hand + InTrn(LT) – PndSales(LT). (1)
Let’s consider the item H1010. To demonstrate how the formula (1) works, we have overridden the item On hand and Qty to receive (see figure below).
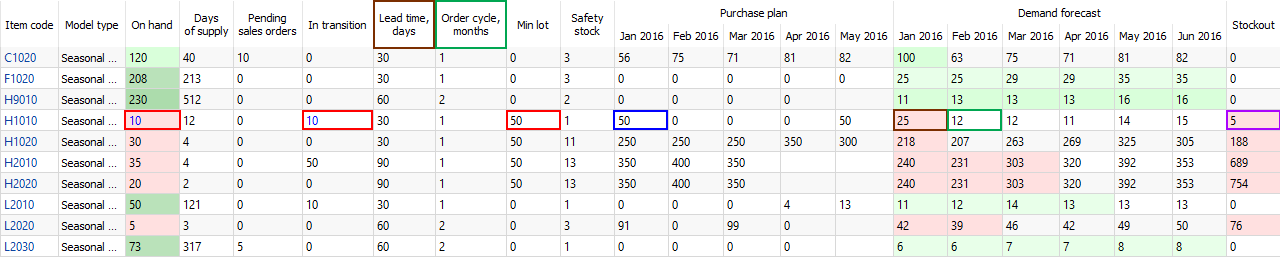
In our case, the inequality (1) is true:
25 > 10 + 10 - 0.
The stockout quantity is shown in the Stockout column of the report. In our example, it is 5 units.
Streamline indicates such items in the inventory report as follows (see figure above):
As you see, there is currently a purchase recommendation. Streamline suggests to order 50 units by 1 of January to cover the demand of 12 units in February. The over-order is because of the minimum lot size of 50 units.
To determine an overstock, Streamline also performs the event-based simulation modeling of stock movements during the lead time plus order cycle period. The inventory level at the end of the simulation is the Overstock quantity.
The rough, static version of the overstock formula would be:
Overstock = MAX(0, On Hand - PndSales(LT+OC) - D(LT+OC) + InTrn(LT+OC) - SS(OC)).
Consequently, a crude rule for an overstock determination is:
On hand + InTrn(LT+OC) – PndSales(LT+OC) > D(LT) + D(OC) + SS(OC). (2)
To calculate an overstock quantity, Streamline uses the following formula:
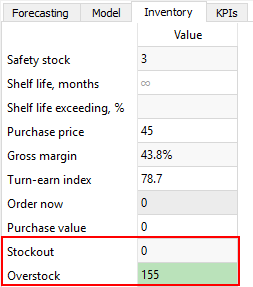
Let’s consider the item L2010 (see figure below).
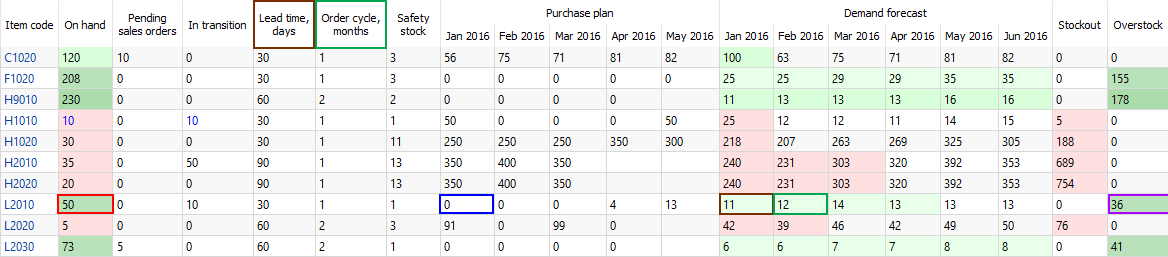
The inequality (2) is true:
50 + 10 - 0 > 11 + 12 + 1.
The overstock quantity is shown in the Overstock column of the report. In our example, it is 36 units.
Streamline indicates such items in the inventory report as follows (see figure above):
As you see, there is no purchase recommendation if an overstock happens.
This is the ideal situation, which Streamline designed to reach. In this case,
D(LT) ≤ On hand + InTrn(LT) – PndSales(LT), (3)
On hand + InTrn(LT+OC) – PndSales(LT+OC) ≤ D(LT) + D(OC) + SS(OC). (4)
Let’s consider the item C1020 (see figure below).
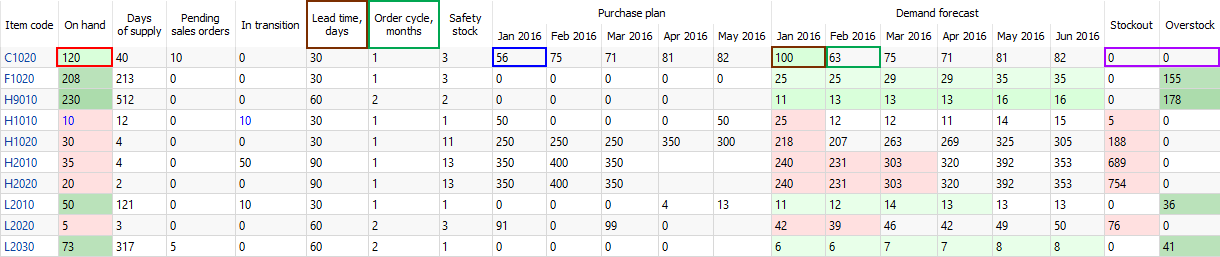
In this case, both inequalities are true:
100 ≤ 120 + 0 - 10,
120 + 0 - 10 ≤ 100 + 63 + 3.
Streamline indicates such items in the inventory report as follows (see figure above):
In our case, we can cover the D(LT) – the demand in January, however, there is not enough inventory to fulfill the D(OC) – the demand in February. That’s why Streamline suggests ordering 56 units (which is 100 + 63 + 3 – (120 + 0 - 10)).
Streamline allows viewing overstocks and stockouts on an item basis or for all of the items in one report.
To view the expected overstock or stockout on an item basis:
To view expected overstocks and stockouts for all of the items in one report, go to the Inventory planning tab (see figure below).
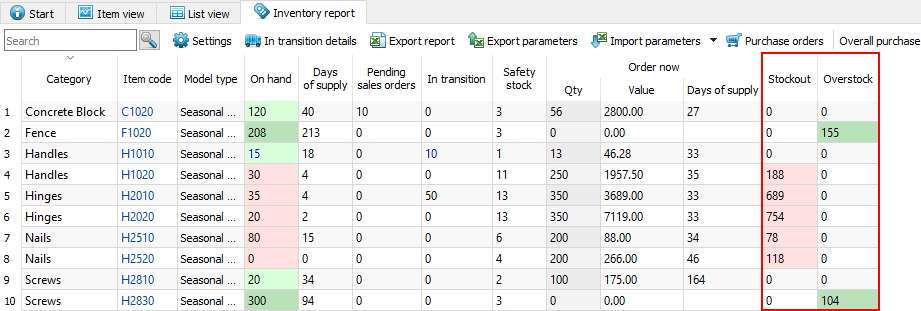
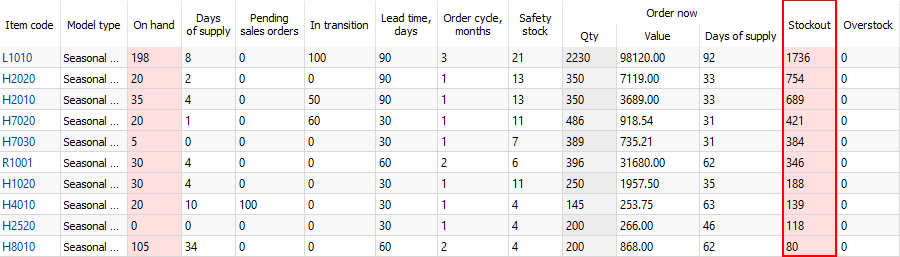
To bring items with overstocks or stockouts to the top of the table, sort the table by the Stockout or Overstock column by clicking the corresponding column header (see figure below).
Streamline allows you to analyze items based on the calculated expected overstock and stockout values. To enable the calculations the item value should be imported.
You can view expected overstock or stockout value on an item basis or for all of the items in one report.
To view the expected overstock or stockout value on an item basis:
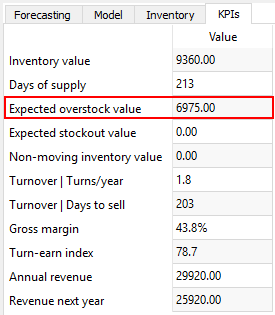
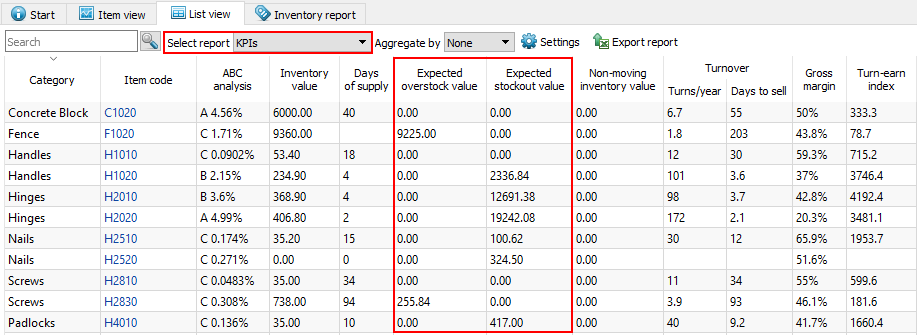
To view expected overstock and stockout value for all of the items in one report, go to the Reports tab and select the KPIs report (see figure below).
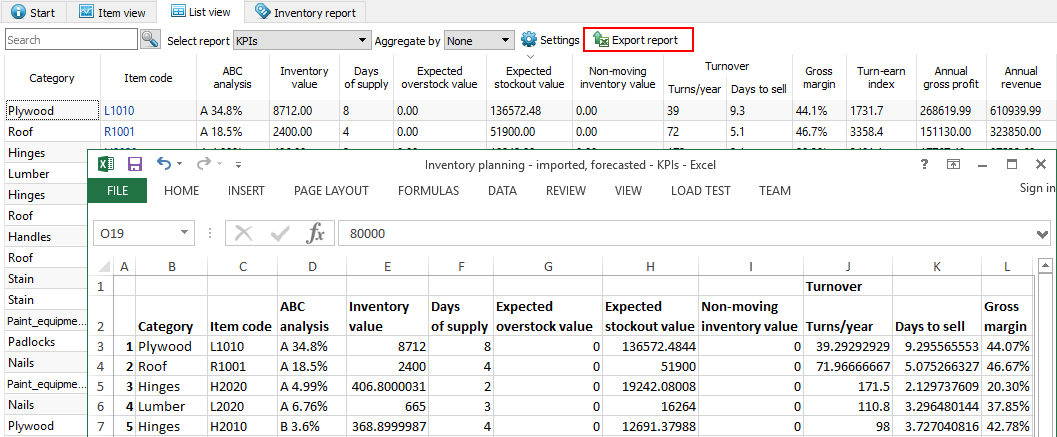
The report can be exported to Excel by clicking the Export report button found on the Reports toolbar (see figure below).
 Manage book (
 Help
Help