User Guide
1. Streamline Client
2.Streamline Server
3. Starting Up
4. Connecting data
5. Demand and Sales Forecasting
6. Inventory Planning
7. Reference
1. Streamline Client
2.Streamline Server
3. Starting Up
4. Connecting data
5. Demand and Sales Forecasting
6. Inventory Planning
7. Reference
 Add this page to your book
  Remove this page from your book
 Historical reports display information in the past based on imported, overridden, and calculated data. These reports include:
Below, we describe these reports in detail.
The Forecast performance report helps you to evaluate the forecast using MAPE. This measure uses the difference between actual data and the forecast. Thus this report can be calculated only when the Period control is set to any option except the last period.
To demonstrate the report, we open the Inventory Planning by Month example and set the Period to Dec 2019 (see figure below).
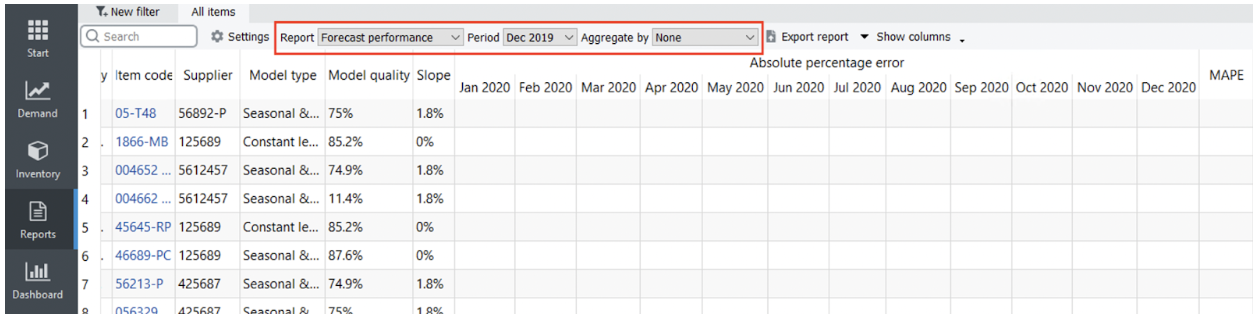
Now, we have an evaluation of the forecasts for the first three months. The rest of the periods were not evaluated because we don't have actual data for those months.
The report data are the Absolute Percentage Error (APE) calculated for a particular planning item/period. The formula for APE is the following:
,
where:
F – the forecast for a particular period; andA – the actual demand in this period.The report data might have gaps or even empty rows. A gap occurs when there were no actual sales in the period. Streamline can’t calculate APE in this case. An empty row arises if either the item is inactive or an intermittent model is used.
The last column of the report represents MAPE calculated across all of the periods for each planning item.
The Overall MAPE, shown in the toolbar, is MAPE weighted across all the items in the project. It is a price-weighted MAPE measure representing the overall revenue percentage error if item prices are imported. Otherwise, it is calculated based on the volume of sales. You can read more about WMAPE on Wikipedia.
You can also switch the forecast quality measure between error and accuracy. To do this, click the Settings button found on the toolbar and select the Accuracy option for the Measure of forecast quality (see figure below).
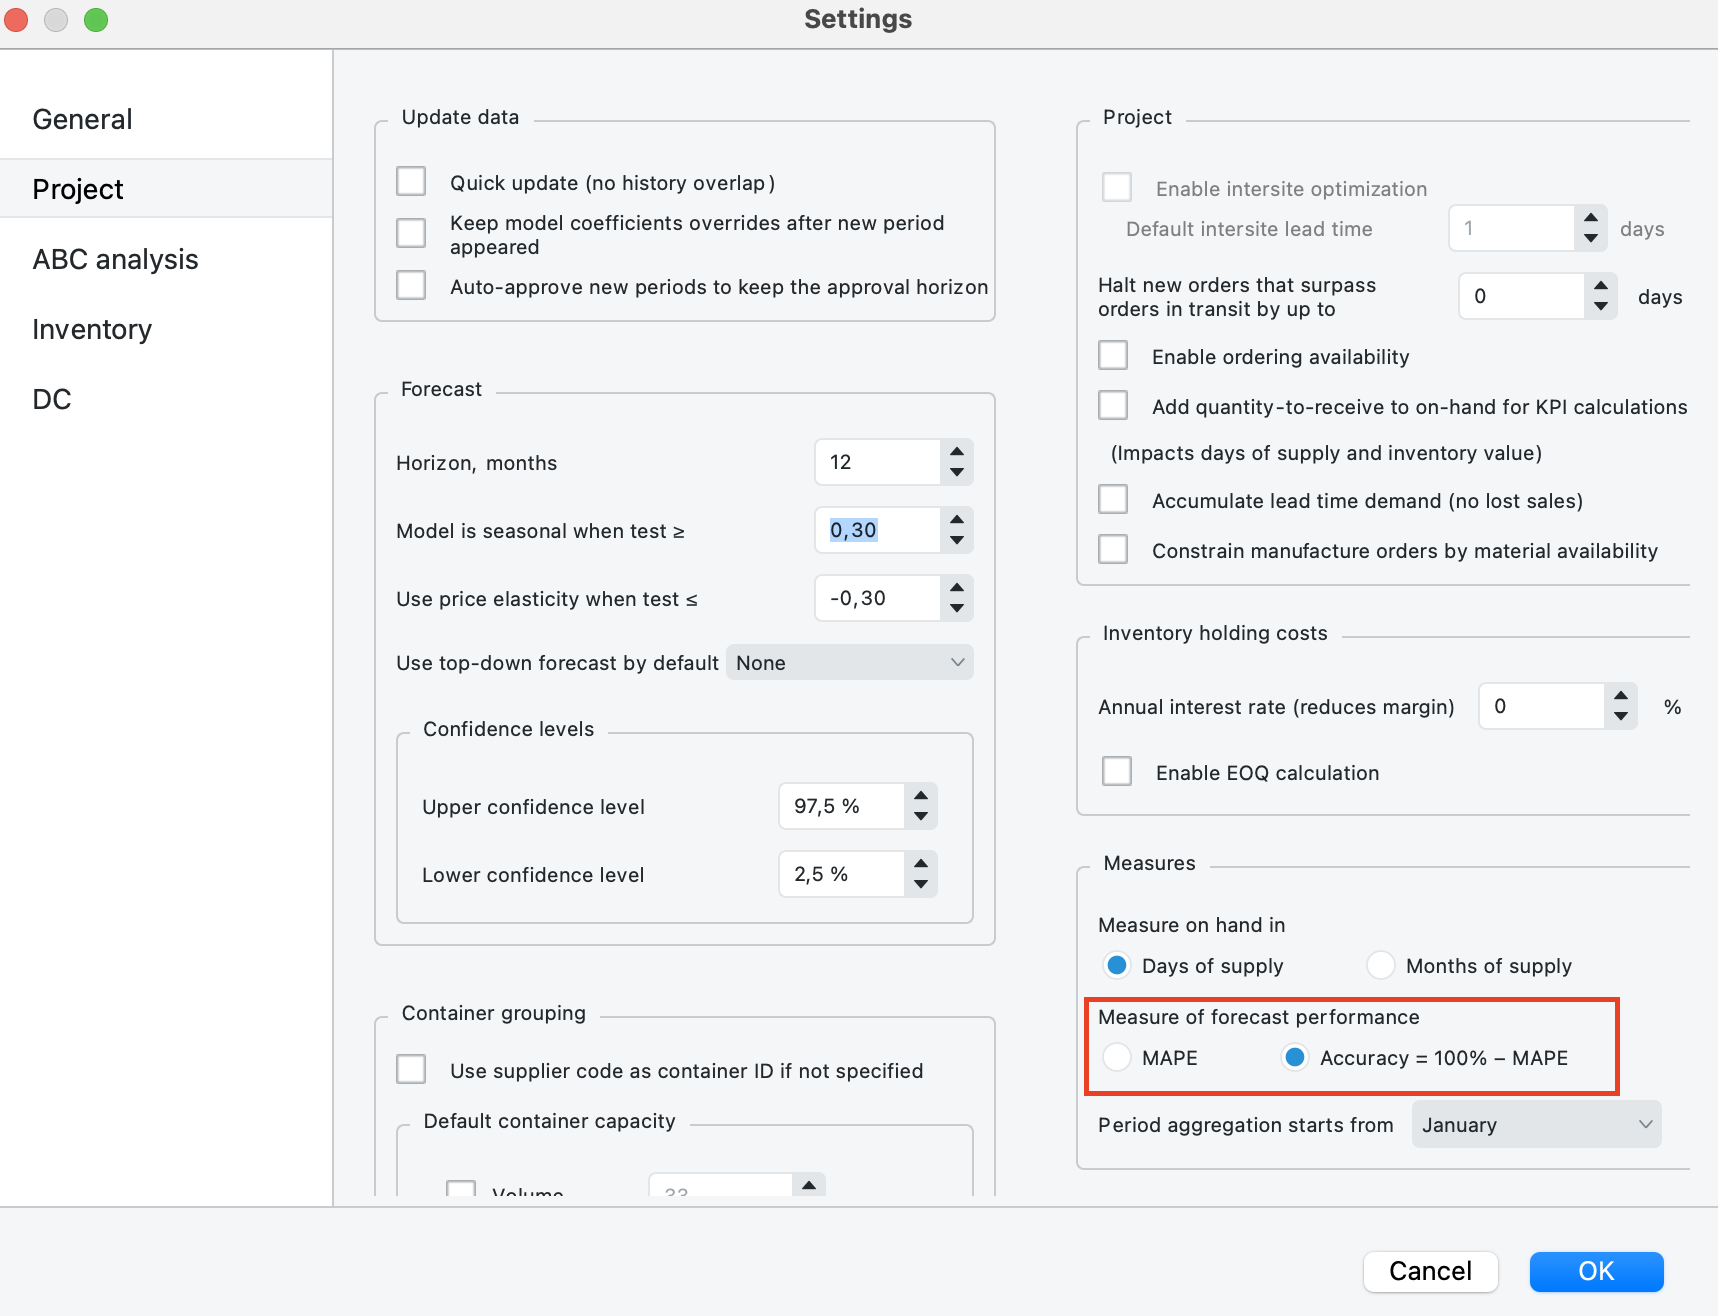
Now, the report shows the percentage accuracy of the forecasts for each period in the Accuracy section and the average accuracy across the available evaluations in the Accuracy column.
The Overall accuracy shown in the toolbar equals to 100% - Overall MAPE now.
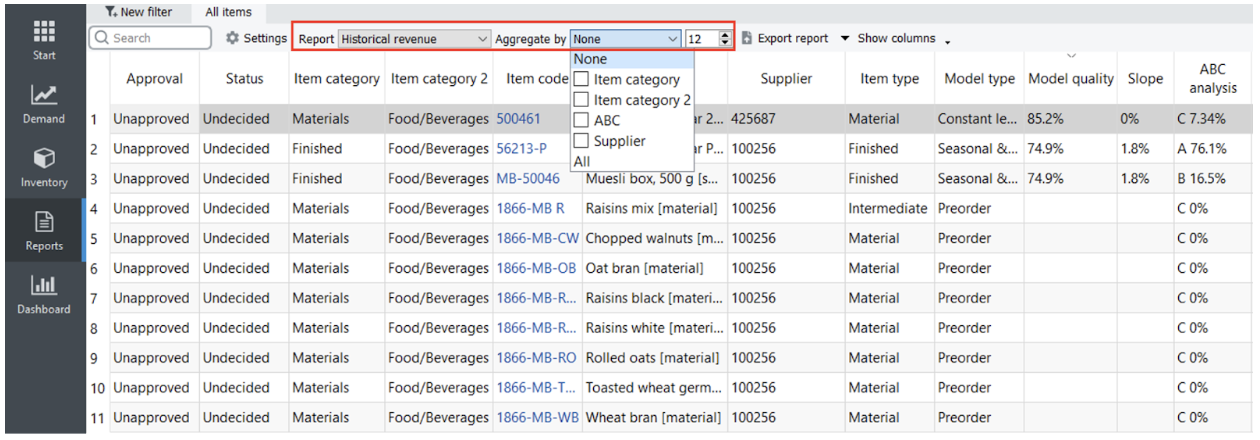
This report shows the revenue obtained during each historical period based on the sales price/unit or transaction revenue data imported from the data source.
This report displays on-hand at the end of each past period including the current period as well (see figure below).
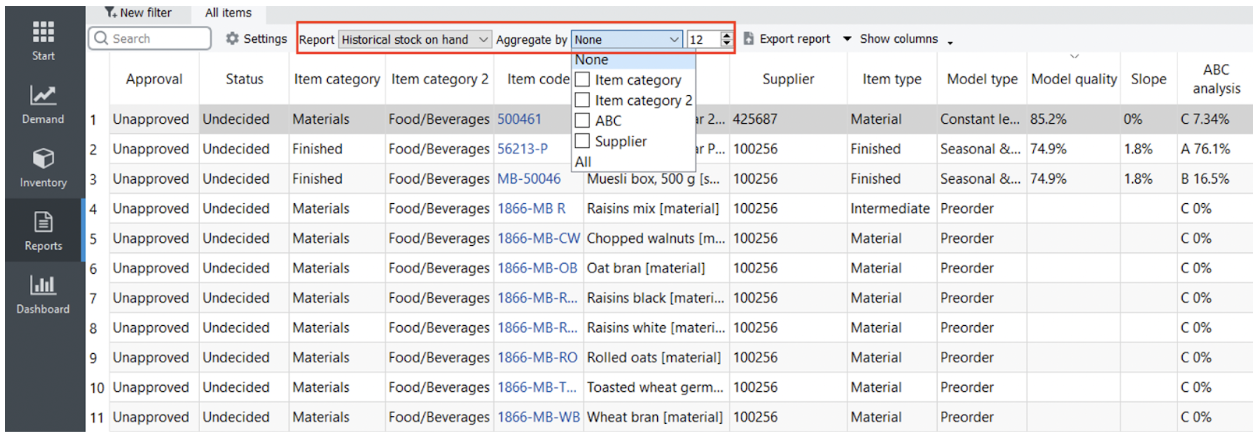
This report is calculated if you provide data to determine On-hand history, which is one of:
The Number of periods control allows you to set up the number of the last periods to show in this report. As you see from the figure above, the report shows on-hand for the last eight months.
The Historical Stockout Days Report shows the number of days you ran out of stock for each period in the past and is calculated when data for On hand history is provided. The report also includes the current period.
This report is calculated if you provide data for On-hand history. The Number of periods control allows you to set up the number of the last periods to show in this report.
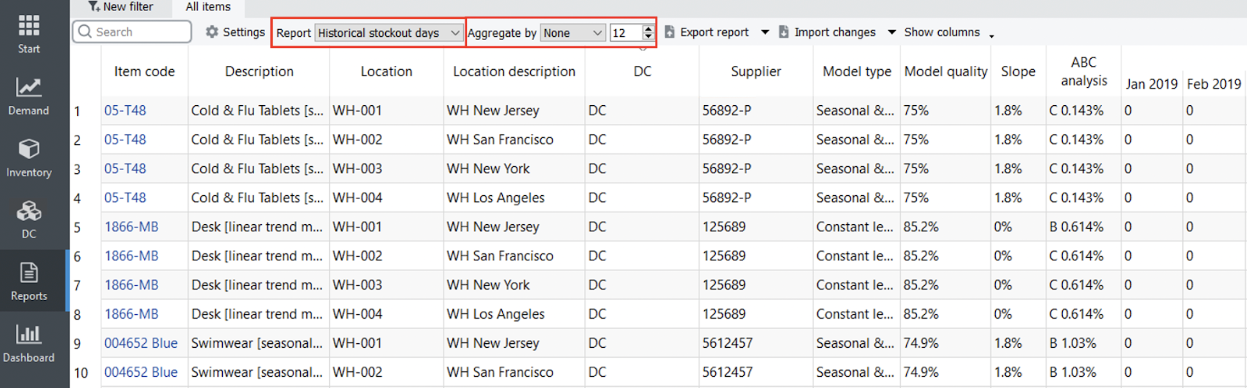
In case you import inventory information in a way that doesn’t allow calculating the Stockout Days automatically you can use the export/import scenario to add this data into the project file manually.
This report shows the turnover of each planning item in each historical period (see figure below).
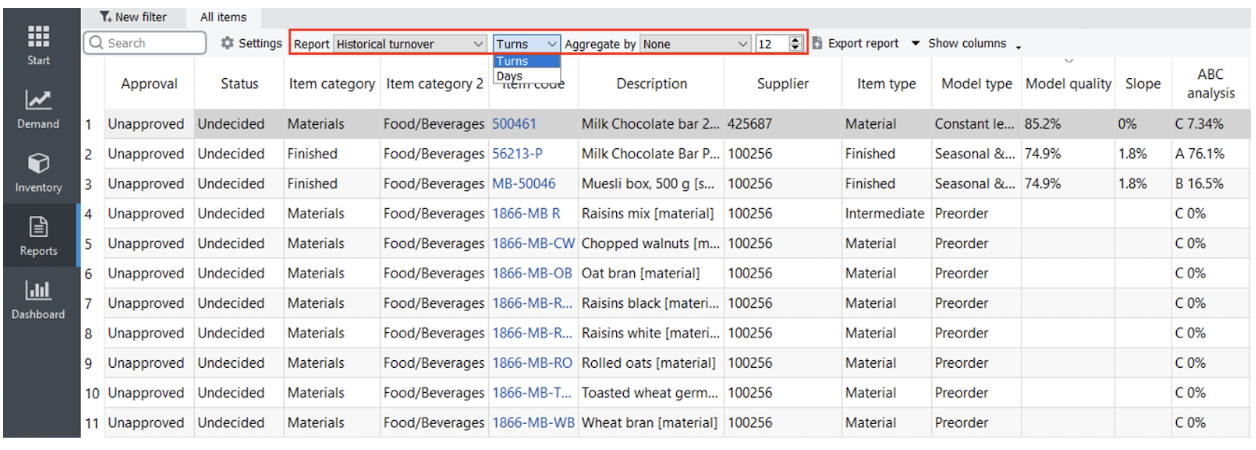
A drop-down at the right of the Report control sets the representation units for this report. These are two options:
Zero value in a period means that there were no sales during this period. An empty cell means that Streamline can't calculate turnover due to zero on-hand in that period. The Number of periods control sets the number of the last periods to show in this report.
 Manage book (
 Help
Help