User Guide
1. Streamline Client
2.Streamline Server
3. Starting Up
4. Connecting data
5. Demand and Sales Forecasting
6. Inventory Planning
7. Reference
1. Streamline Client
2.Streamline Server
3. Starting Up
4. Connecting data
5. Demand and Sales Forecasting
6. Inventory Planning
7. Reference
 Add this page to your book
  Remove this page from your book
 The goal of the Inventory planning tab is to generate an ordering plan for locations that are not replenished from DCs. Ordering plan for DCs is on the Distribution center tab.
Depending on the Streamline configuration, an ordering plan may include any combination of the following:
A planning item in an ordering plan belongs to one of the four mentioned plans. Besides the ordering plan, this tab provides a range of other important outcomes, including expected overstock and stockout amounts.
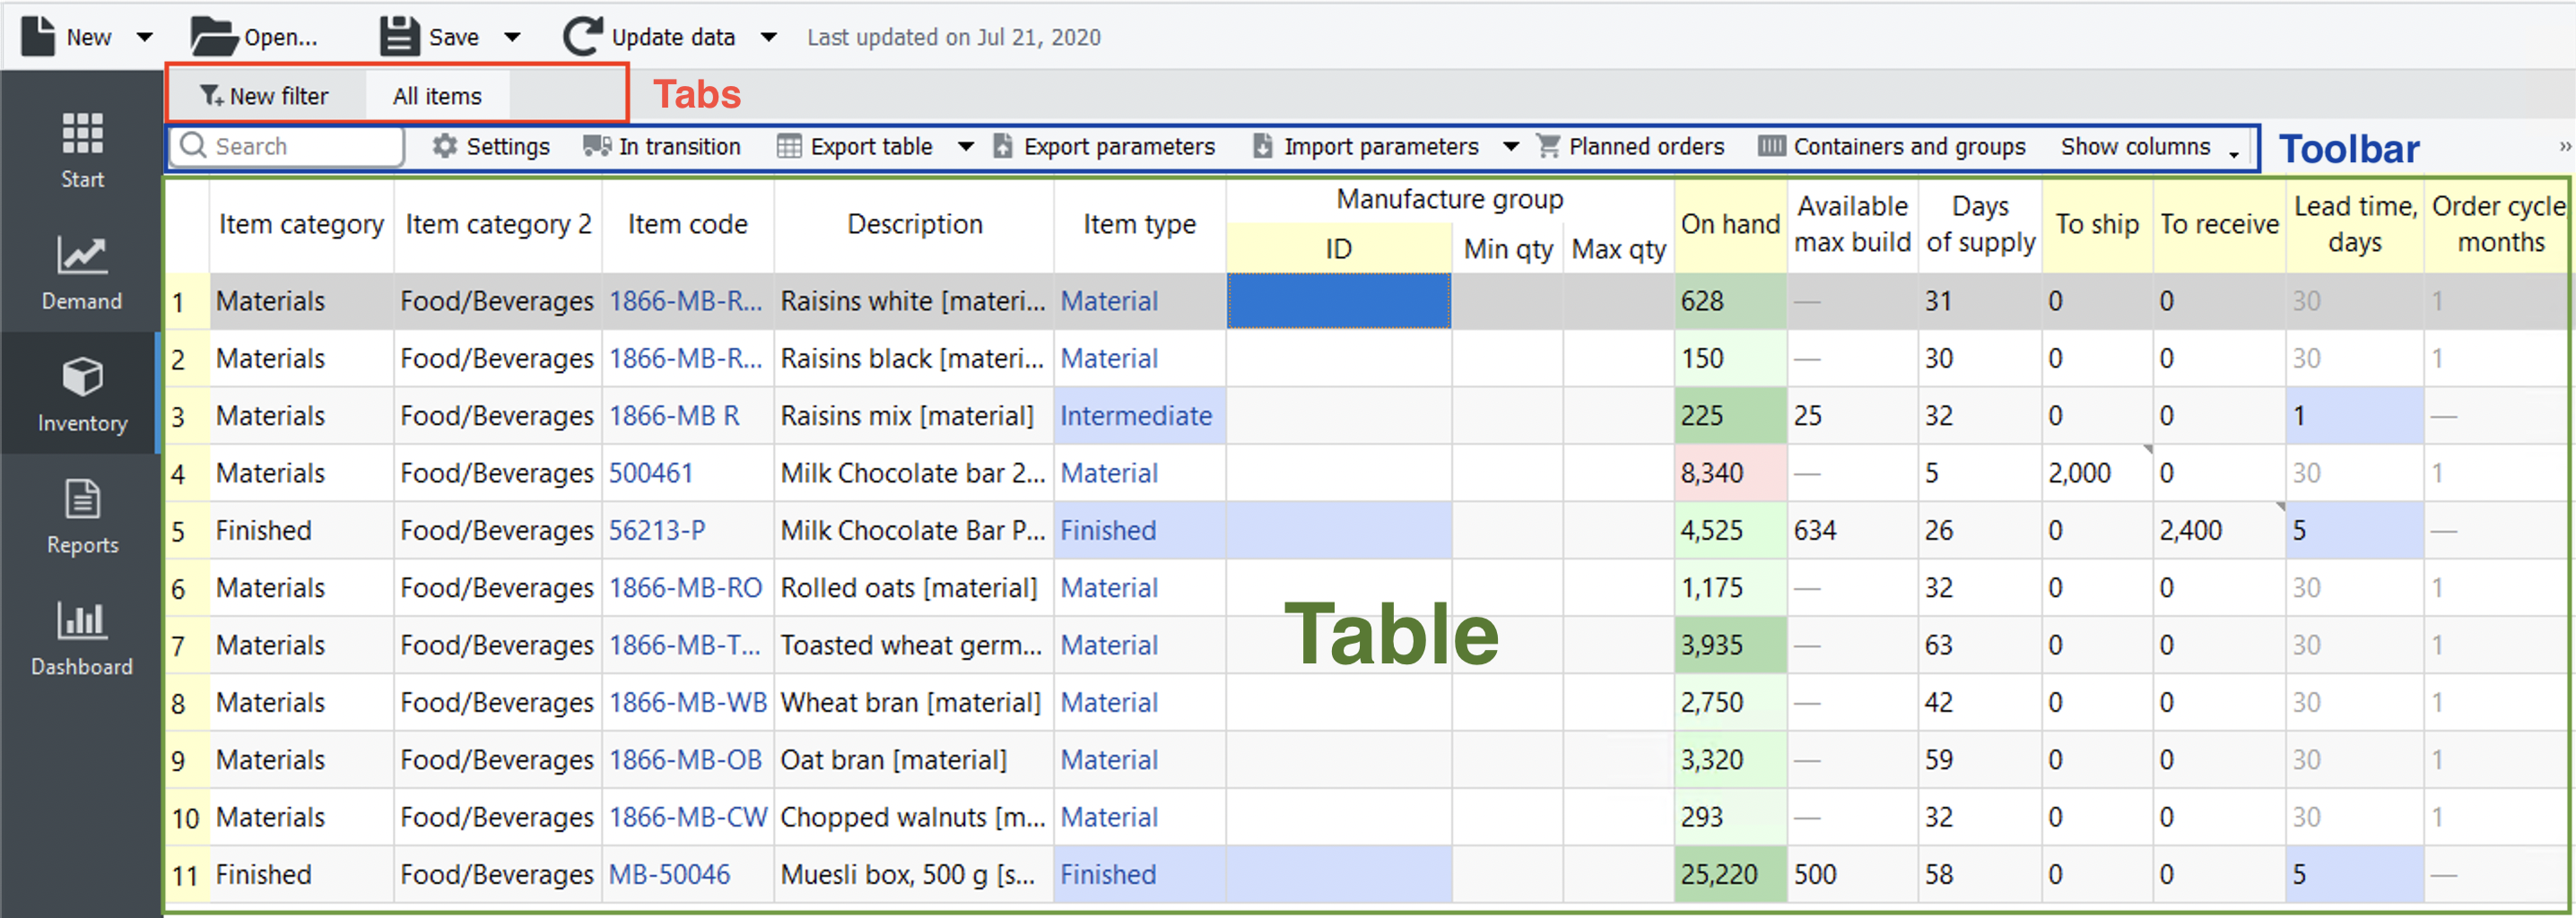
Inventory planning tab contains a set of tabs or reports, a toolbar, and a table under each tab (see figure below).
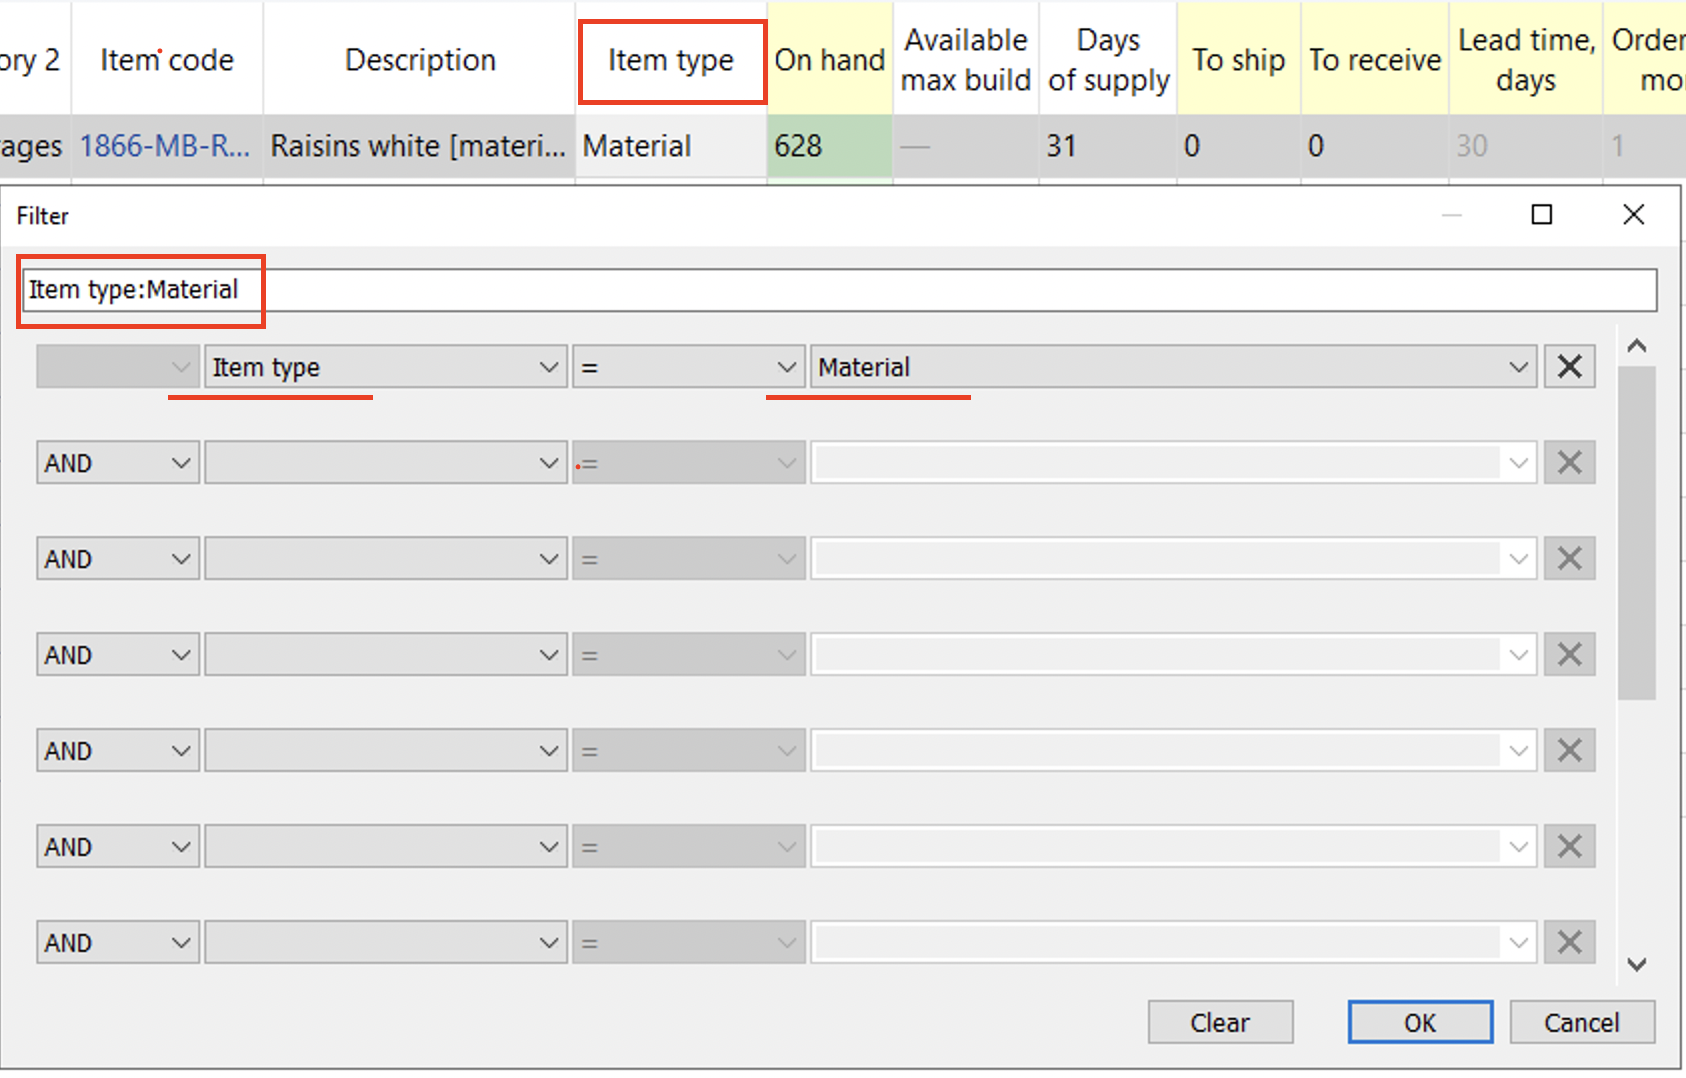
By default, the tab area includes only one report All items and the New filter button that opens the Filter dialog. In this dialog, you can specify the filtering criteria for the new custom report. As soon as you configure the filter, Streamline creates a new report based on it and adds it to the set of tabs as a newly created tab.
The All items report, as well as any other custom report, is customizable. The table below shows the customizations and the scope they are applied to.
| Customization | Scope |
|---|---|
| Show/hide a particular set of columns of the report using the Settings. | All of your reports at once. |
| Recalculate the report based on the given replenishment parameters. | |
| Display the necessary set of planning items by creating a new report using filters or editing the filter of the current report. | Current report |
| Sort the report by any column or a set of columns. |
Also, you can export any report to an Excel file.
As you see, reports in this tab are interactive, since allowing manual change of the parameters, and are recalculated after the change. There are several ways to change replenishment parameters. The easiest one is modifying them right in the report by editing the columns having a yellow background.

1. Click on a little triangle near the button.
2. Select the Choose file… command.
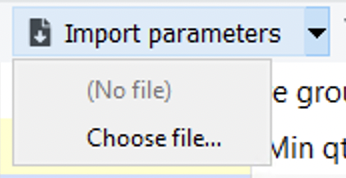
3. Choose the file and click OK.
Each report in the Inventory planning tab contains a table. Columns of these tables are the same for each of them. Table columns can be divided into the following categories:
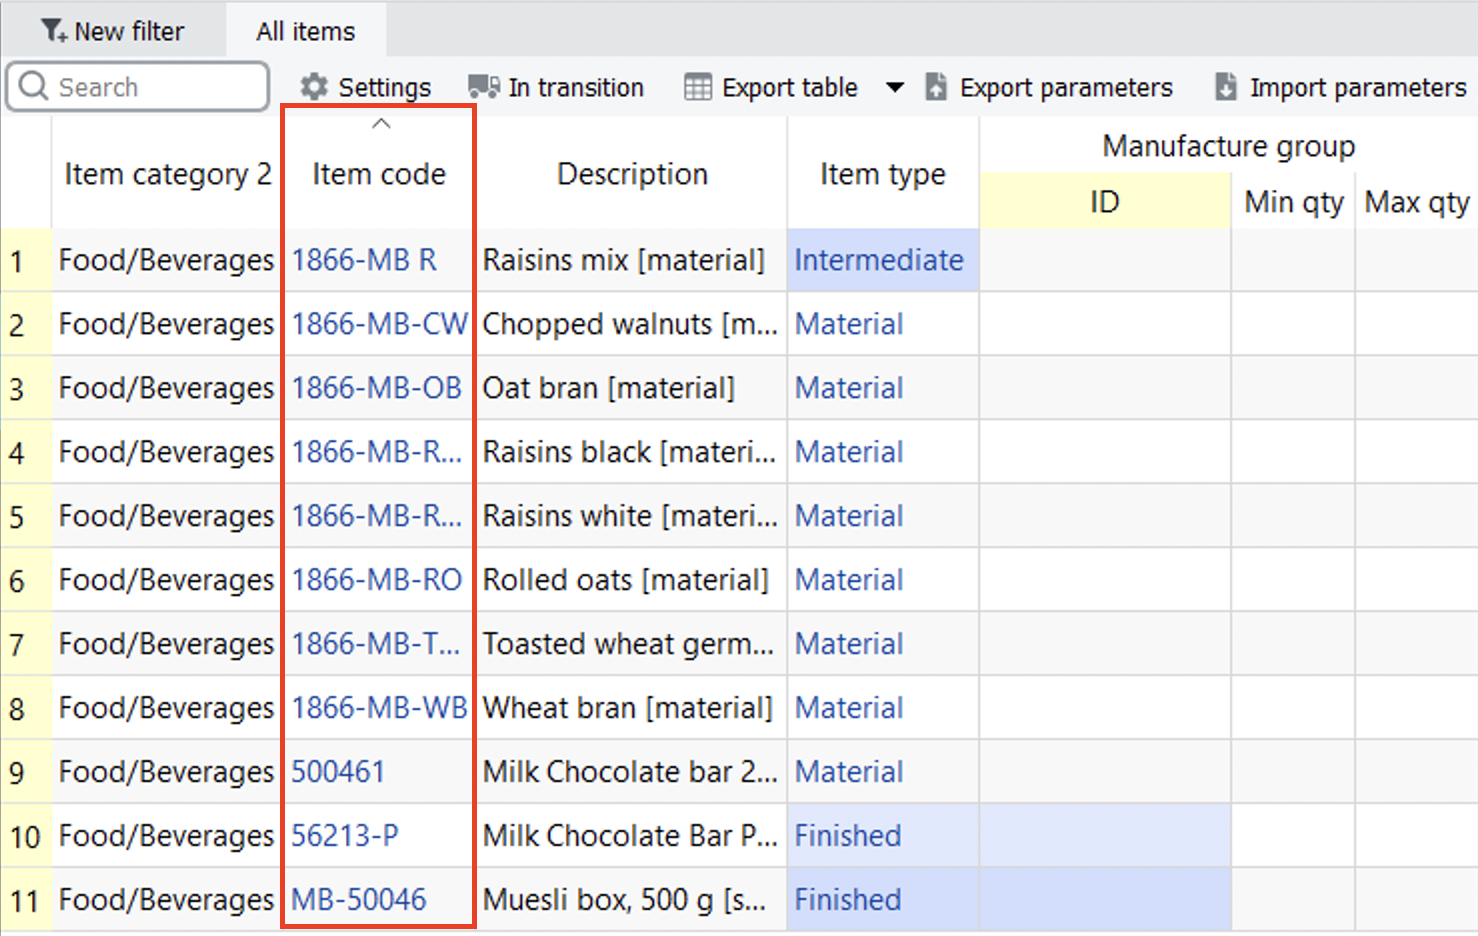
There is an ability to sort each report by a particular table column or even a set of columns in both directions. To sort by a single column, click at its header (see figure below). To reverse the sort, click the column header again.
Sorting is stable. It means that it keeps the order of records original for the records with equal values in the sorted column. This feature allows sorting by an ordered set of given columns.
Consider an example shown in the figure below.
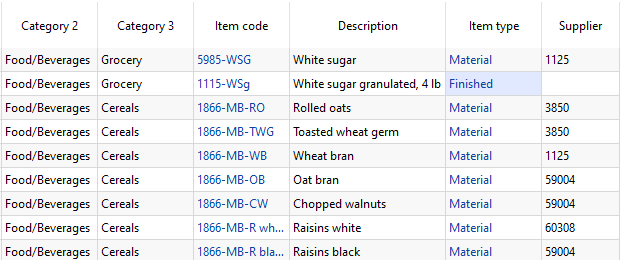
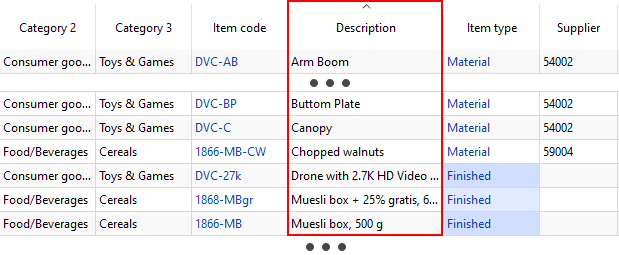
Let's sort this table by the following three columns in the order – Category 2, Category 3, and Description. And, for instance, sort them in ascending order. To do this, we should start clicking column headers in the backward direction, since the result of the currently sorted column has a higher priority over the previous sorted columns. So, let's start with the Description column (see figure below).
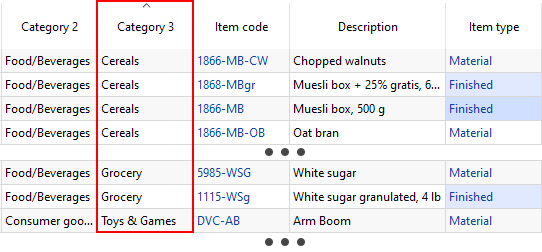
Then, by the Category 3 (see figure below).
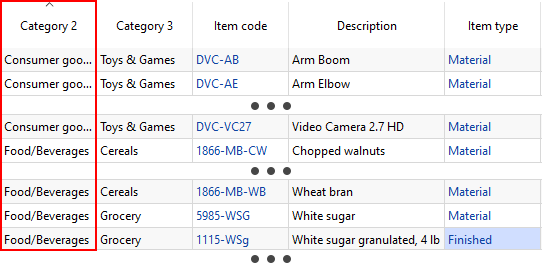
And finally, by the Category 2 (see figure below).
If you accidentally click on the header of a wrong column, repeat the right sequence all over again.
Additional capabilities of the table
Clicking on the Item code of the item moves you to the Demand tab and sets the cursor on a tree of a proper item code. Clicking on the Item type of the item, Streamline opens a Material/Product tree dialog for this item code.

Also, in order to quickly hide columns, right-click on the name of the column and select the hide column option in the drop-down menu.

The table below describes all of the columns.
| Column | Description | |
|---|---|---|
| Inventory information | ||
| <Item category> | Streamline shows the column configured as item category in the table. The name, imported for this column, is displayed in the column header. | |
| <Location category> | Streamline shows the column configured as location category in the table. The name, imported for this column, is indicated in the column header. | |
| <Item info field> | Streamline shows the characteristic of the item imported through the Info field data type in the table. The name, imported for this characteristic, is shown in the column header. | |
| Item code | An identifier of the item also known as SKU. | |
| Location | It shows the store or the warehouse where the Item code is stored. | |
| Transfer region | Shows the name of the transfer region for the Location belogs to. This column is shown if the transfer region data type is imported. It is used for inventory optimization via intersite transfers. | |
| DC | It displays the distribution center name the planning item is supplied from. | |
| Description | This column shows the description of the Item code. | |
| Model type | It displays the type of the forecasting model selected to generate the forecasts for the planning item. | |
| Item type | It indicates the type of the item in the context of manufacturing. There are three types of items, Material, Intermediate and Finished item. This column is shown if bill of materials was imported. A blank cell in this column refers to a regular item; it is not involved in any manufacturing process. | |
| Supplier | Shows the code of the supplier for the planning item. | |
| Purchase price | It is the price you pay the supplier for the item in the supplier's currency. This column is shown if the item purchase price was imported. | |
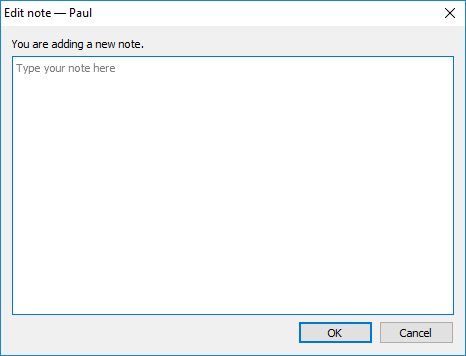
| Note | Shows the annotation for the planning item. Notes can be created using the context menu of the table or at the Demand forecasting tab. | |
| Replenishment parameters | ||
| On hand | The amount of the Item code that is currently in stock at the Location. | |
| To ship | Shows the total quantity on open sales orders and backorders. If open sales orders and backorders are imported separately from the inventory information, this column shows a little triangle in the corner of the cell. If you hover over it, Streamline shows a popup containing a list of pending shipments. | |
| To receive | Shows the total amount on open purchase, transfer, and manufacturing orders. If those orders are imported separately from the inventory information, this column shows a little triangle in the corner of the cell. If you hover over it, Streamline shows a popup containing a list of pending arrivals. | |
| Lead time | Shows the interval of time between transfer/purchase order placement and its receipt. Streamline shows dashes for Finished and Intermediate item, meaning that the lead time for them can't be given. By default, it eqauls to zero. | |
| Order cycle | Shows how often the item is ordered from the supplier or distribution center. Order cycle can be set in months or days, or attached to the Lead time period. | |
| Service level | It is the percentage of the time (in the long run) that the item is available in stock. | |
| Safety stock periods | Shows the number of future periods which demand is used as the Safety stock. | |
| Replenishment constraints | ||
| Min lot | It is the minimum quantity of the planning item that you can order from your supplier or distribution center. | |
| Max lot | It is the maximum amount of the planning item that you can order from your supplier or distribution center. | |
| Rounding | It is a constraint that rounds the Net order amount up to the given quantity. It allows Streamline to take into account how many items come packed in a carton, allowing the application to suggest exactly the right amount of the item to order. | |
| Display qty | It is the minimum number of units a shelf has to display. This parameter typically arises in the retail business. You can control how this amount is used when the final safety stock is calculated. | |
| Shelf life | It is the desired time the item can be in stock. Streamline converts this time period into a shelf life quantity. And this amount is used as a maximal limitation on the Net order quantity when the current order quantity is calculated. A cell in this column has a red background if the Net order quantity exceeds the shelf life quantity. | |
| Shelf life exceeding | It shows the average percentage of the current order quantity that we might have to: send to a clearance sale, return to the supplier and so on. If you just discard the expired product, the percentage should be very small. If you recycle them (e.g. roast the meat or make a clearance sale), the numbers may be larger. | |
| Outcomes | ||
| Days of supply | Shows how many days of the future demand, starting from the project date, the current On hand (including orders to ship) can cover. You can change the representation units for this indicator, days or months in the Settings. | |
| Safety stock | Indicates the safety stock for the planning item. Its calculation depends on the Model type, the inventory replenishment strategy, the method set in the Settings, and availability of the Display qty constraint. | |
| Safety stock debt | This section indicates three characteristics of safety stock: 1) safety stock debt received from the lower echelon; 2) safety stock debt accumulated at the current echelon; and the 3) safety stock debt calculated at the current echelon and then passed to the upper echelon. | |
| Received | The total of the safety stock debts passed from the lower echelon. | |
| Accumulated | The accumulated safety stock debt that is calculated at the current echelon. | |
| Passed | The safety stock debt passed to the upper echelon. | |
| Gross margin | Shows the gross profit margin of the planning item. | |
| Turn-earn index | Indicates the item gross margin accumulated over the last 12 months. | |
| Current order | This section displays information on the current order. | |
| Qty | It is the recommended quantity to order currently. An example of this column calculation can be found in the Ordering plan calculation article. | |
| Net order | It is the current order quantity before application of constraints. | |
| Excess order | Shows the excess part of the сurrent order quantity that is gotten due to the application of the constraints. In other words: Excess order = Qty - Net order |
|
| Value | Shows the value of the current order line in the supplier's currency. It is calculated based on the given item purchase price. | |
| Margin | This column shows the gross profit margin calculated for the current order. The sellout_time equals to the Days of supply of the current order when it is calculated. This column is shown if the Annual interest rate is set in the Project settings. |
|
| Days of supply | Shows how many days of the future demand, starting from the Delivery date, the current order quantity can cover. | |
| Order type | Indicates the order type the current order line blongs to. There are three types of orders, Purhcase, Transfer and Manufacturing. Streamline automatically determines it based on the Source from and the Item type columns. If those are not given, Streamline considers the order to be a purchase. | |
| Source from | Displays the source from where the planning item is currently ordered. This column shows:
|
|
| Delivery date | Shows the promised date on which the planning item is to be delivered. Its calulation depends on the Order type. Below we describe how it is determined. | |
| Next order date |
It indicates the date the next order should be placed by. This column is automatically calculated for the exported order lines as you click the Create button in the Planned orders preview dialog. In this case, the date is calculated as: Next order date = Today date + Order cycle,
where Today date is the current date set on your machine. Next order date = Sendout date + Order cycle. |
|
| Reorder point | Displays the inventory level at which a replenishment order should be placed. It is the sum of the lead time demand and the Safety stock. This column is shown if the Min/max replenishment strategy is set in the Settings. | |
| Max inventory | It is the maximum inventory level for the item in the current period. This column is shown if the Min/max replenishment strategy is applied. | |
| DC fill rate | It indicates the percentage of the current DC demand that DC on hand can cover. The current DC demand is the total of all the current replenishment orders from the lower echelon plus DC current order quantity calculated based on its sales demand. | |
| Stockout | It is the maximal expected inventory shortage during the Lead time period. | |
| Overstock | Shows the expected inventory level at the end of the Lead time plus Order cycle period. | |
| Write-offs | Indicates the total of the projected write-offs over the forecast horizon. | |
| Ordering plan | This section contains ordering recommendations for the whole forecast horizon. The current order recommendations are shown in the first column of this section. The values in the plan indicate the quantities that should be ordered in the corresponding periods. After you export the current order recommendations, Streamline shows the date to place the next order by in the Next order date column of the table. To understand how this plan is calculated and see the placement dates for all of the recommended orders, you can address to the Ordering plan calculation article. This section is hidden by default; you can show it by enabling the option Show entire ordering plan in the Settings. | |
| Demand forecast | This section shows the final demand forecast for every period within the forecast horizon. | |
| Projected inventory levels | This section comprises the expected inventory levels at the end of each period within the forecast horizon. To understand how these are calculated, address to the Ordering plan calculation article. This section is hidden by default; you can show it by enabling the option with the same name in the Settings. | |
Constraints Min lot, Max lot, and Rounding can't be given for manufacturing items. Streamline shows dashes in these columns for them. Empty cells or zero values in the Min lot, Max lot, and Rounding columns mean that no constraints are applied in the optimization.
Streamline allows for changing the way the Inventory value and Non-moving inventory value KPIs are calculated. You can set Streamline to account for the To receive quantity of purchase orders when it calculates these in the Settings.
The table below shows how Streamline determines the expected Delivery date for an order line depending on the Order type.
| Order type | Location | Condition | Delivery date |
|---|---|---|---|
| Purchase | Location/DC | Today date + supplier Lead time | |
| Transfer | Location | The location is linked to a DC (the DC column is not empty) | Today date + Lead time from DC to the location |
| The location is not linked to a DC | Today date + 1 day | ||
| Manufacturing | Location/DC | Today date + 0 days |
Where Today date is the current local date set in your operating system.
The table in the All items report has a color-coding helping you recognize red-flag items. To describe the color-coding, let's introduce the following notation:
Below we describe the meaning of colors used in the colored columns or sections of the table.
| Color | Meaning |
|---|---|
| Pink | The quantity is insufficient to cover D(LT). |
| Light-green | The quantity is enough to satisfy D(LT). |
| Green | The quantity is enough to satisfy D(LT+OC). |
| Color | Meaning |
|---|---|
| Pink | Indicates stockouts in the Stockout column. |
| Green | Hightlights overstocks in the Overstock column. |
| Color | Meaning |
|---|---|
| Pink | Designates periods with stockout. |
| Light-green | Specifies periods in which demand will be fully covered with (On hand + ToReceive(LT+OC) - ToShip(LT+OC)) quantity. |
The All items report (or any other custom report) has a context menu that includes the most commonly used operations applied to the currently selected planning item in the table.
To open the context menu, right-click on the planning item (see figure below).
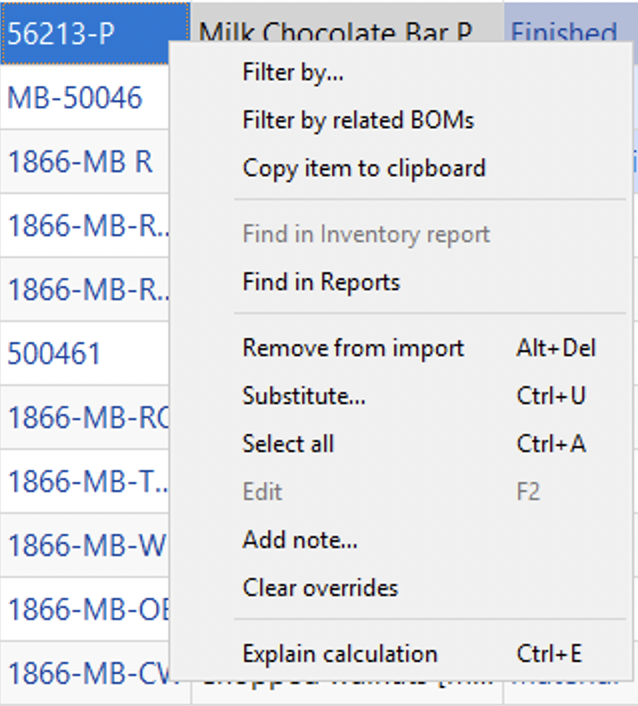
Below we give a description of the commands.
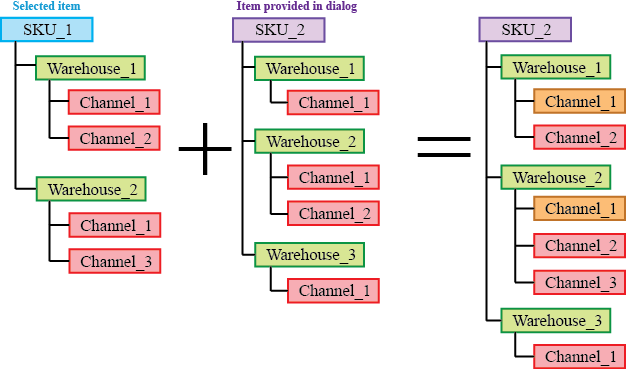
Orange in the figure above indicates the channels with merged histories.
 Manage book (
 Help
Help